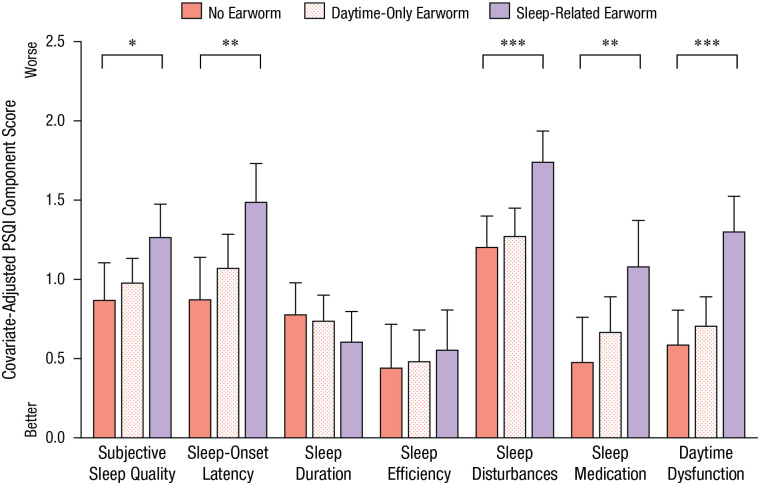
Fig. 2.
Mean score in Study 1 for each of the seven components of the Pittsburgh Sleep Quality Index (PSQI), separately for the no-earworm, daytime-only-earworm, and sleep-related-earworm groups. Analyses were adjusted for gender. Error bars represent +1 SE. Asterisks indicate significant differences between groups (*p < .05, **p < .01, ***p < .001).

