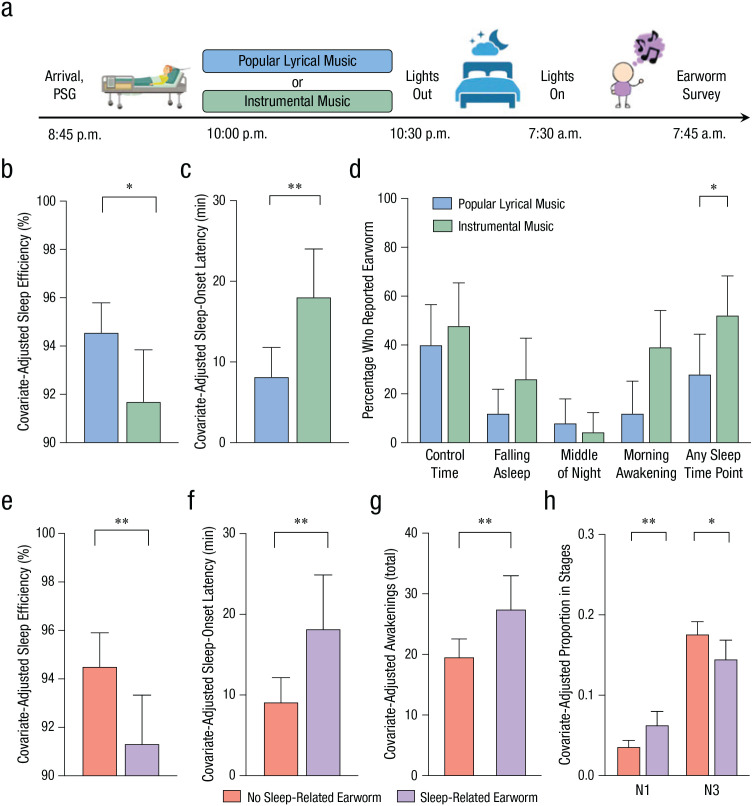
Fig. 4.
Procedure and results of Study 2. Participants arrived at a light- and sound-controlled laboratory (a), and each participant was randomly assigned to listen to either popular lyrical music or instrumental-only versions at a quiet volume. Polysomnography (PSG) was used to measure sleep quality, and participants completed an earworm survey after waking. The top row of graphs shows (b) prebed sleep efficiency, (c) sleep-onset latency, and (d) the percentage of participants who reported earworms at separate time points. Results are shown separately for each music condition, and asterisks indicate significant differences between conditions (*p < .05, **p < .01). The bottom row of graphs shows (e) sleep efficiency, (f) sleep-onset latency, (g) the number of awakenings, and (h) sleep quality at N1 (light sleep) and N3 (deep sleep). Results are shown separately for participants who reported earworms and those who did not. Asterisks indicate significant differences between earworm conditions (*p < .05, **p < .01). Gender, insomnia stress vulnerability, and morningness-eveningness preferences were included as covariates in these analyses. Error bars represent upper bounds of 95% confidence intervals.

