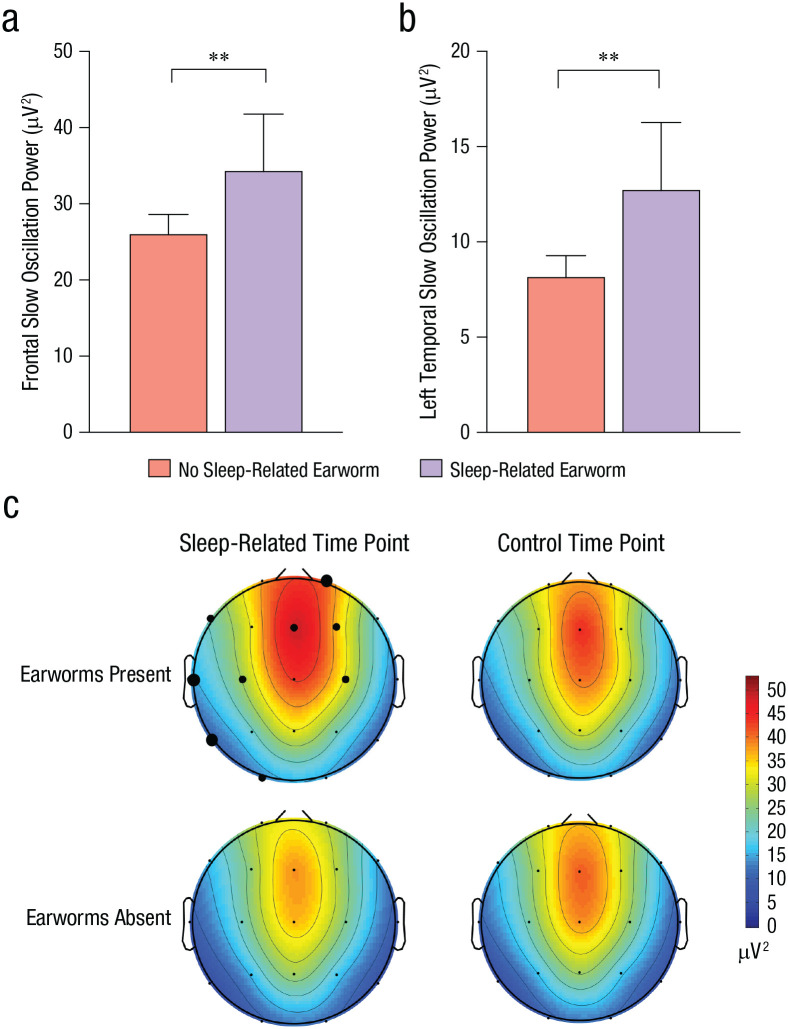
Fig. 5.
Results of Study 3. The graphs show slow oscillation activity in averaged (a) frontal channels and (b) left temporal (T3, T5) channels for participants who reported and did not report sleep-related earworms. Error bars represent upper bounds of 95% confidence intervals. Asterisks indicate significant differences between earworm groups (p < .01). The heat maps (c) show oscillation power in frontal and left temporal regions at sleep-related and control time points, separately for each earworm group. The size of the black dots indicates the level of significance (small: p > .05, medium: p < .05, large: p < .01).

