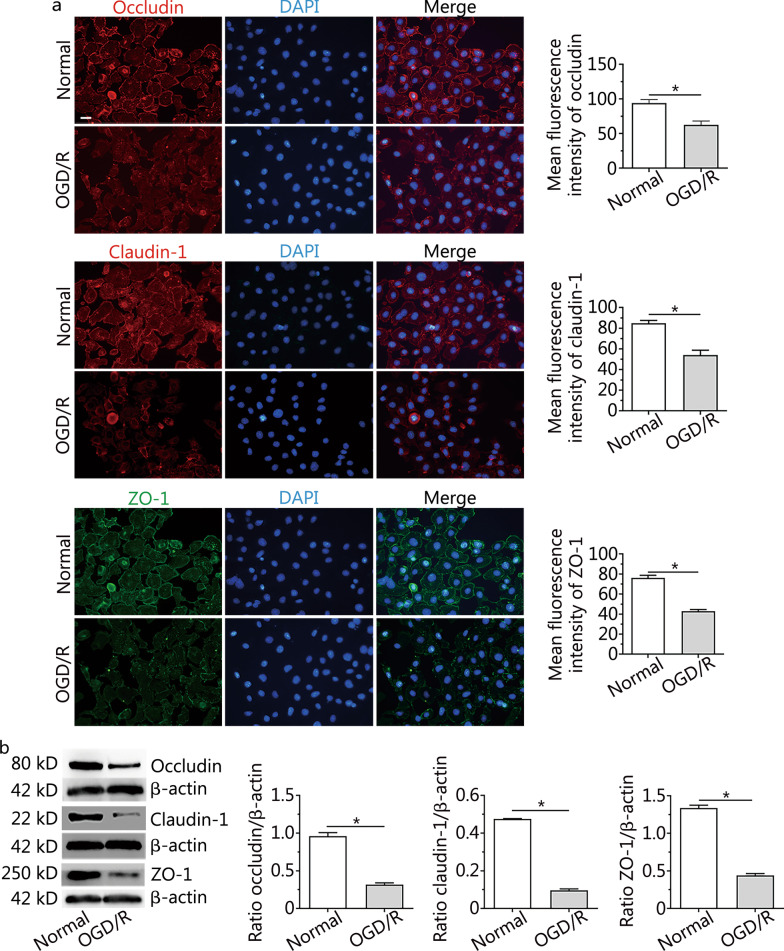
Fig. 3.
Changes to occludin, claudin-1 and ZO-1 proteins in RBMVECs after OGD/R. a Immunofluorescence staining and quantitative analysis of occludin, claudin-1 and ZO-1 proteins in RBMVECs in each group. b Representative Western blotting images of occludin, claudin-1 and ZO-1 in RBMVECs in each group. Data are presented as the mean ± standard deviation (SD) from three independent experiments. *P < 0.001, compared with the normal group. All scale bars = 50 µm. OGD/R oxygen–glucose deprivation and reoxygenation. RBMVECs rat brain microvascular endothelial cells

