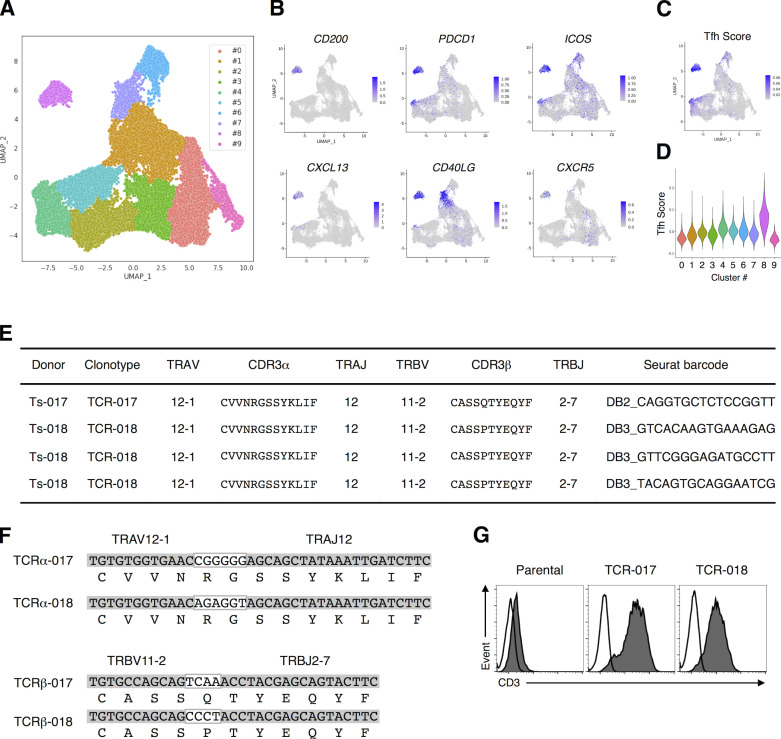
Figure 1.
TCRs shared by SARS-CoV-2–reactive Tfh cells from different patients. (A) UMAP projection of T cells in single-cell analysis of PBMCs identified a cluster representing Tfh cells (cluster #8). Each dot corresponds to a single cell and is colored according to the cluster. (B) The expression levels of the canonical Tfh cell markers CD200, PDCD1, ICOS, CXCL13, CD40LG, and CXCR5 are shown as heatmaps in the UMAP plot. (C) Tfh scores of T cells in single-cell analysis of PBMCs are shown as heatmaps in the UMAP plot. (D) Tfh score of each cluster determined in A is shown in a violin plot. (E) Usages of V and J gene segments and CDR3 sequences of the α (TRAV, TRAJ, and CDR3α, respectively) and β chains of TCR-017 and TCR-018. For TCR-018, three different barcoded clones having the same nucleotide sequences detected in Ts-018 are shown. (F) Alignment of CDR3α and CDR3β nucleotide and amino acid sequences from TCR-017 and TCR-018. Nucleotide sequences within the white boxes indicate N-nucleotides. (G) Surface expression of paired TCRs on reporter cells are assessed by surface anti-CD3 staining. Filled histogram, anti-mouse CD3 mAb; open histogram, isotype control antibody. Data are representative of three independent experiments (G).

