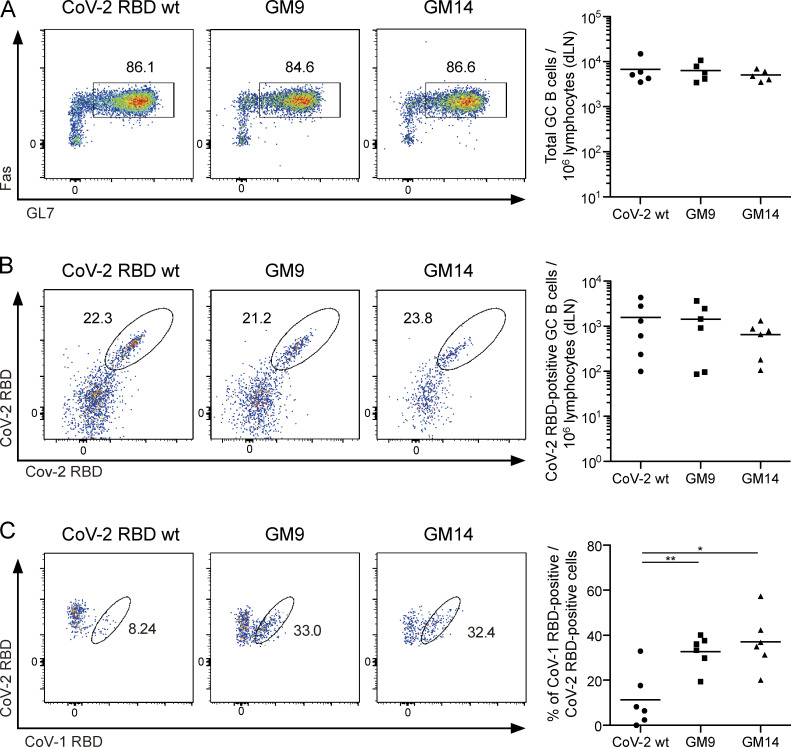
Figure 4.
Immunization with CoV-2 GM antigens leads to the activation of CoV-1 and CoV-2 cross-reactive GC B cells. (A) Representative flow cytometry plots analyzing GC B cells (CD138−B220+IgD−IgM−GL7+Fas+) from draining lymph nodes (dLNs) of mice 3 wk after primary immunization with each antigen. The plots are representative of findings from two independent experiments (left). Quantification of absolute numbers of GC B cells (right) from multiple mice in one experiment. Results are representative of two independent experiments. CoV-2 RBD WT (n = 5); GM9 (n = 5); GM14 (n = 5). (B) Representative flow cytometry plots analyzing CoV-2 RBD–binding dLN GC B cells (CD138−B220+IgD−IgM−GL7+Fas+CoV-2 RBD+). Plots are representative of findings from two independent experiments (left). Quantification of absolute numbers of GC B cells (right) from multiple mice in one experiment. Results are representative of two independent experiments. CoV-2 RBD WT (n = 6); GM9 (n = 6); GM14 (n = 6). (C) Cross-reactivity of CoV-2 RBD-binding dLN GC B cells (CD138−B220+IgD−IgM−GL7+Fas+CoV-2 RBD [APC]+ CoV-2 RBD [PE-Cy7]+) with CoV-1 RBD assessed by flow cytometry. Plots are representative of findings from two independent experiments (left). The frequency of CoV-1 and CoV-2 RBD cross-reactive GC B cells (right) from multiple mice in one experiment. Results are representative of two independent experiments. CoV-2 RBD WT (n = 6); GM9 (n = 6); GM14 (n = 6). Horizontal lines indicate mean values; each symbol indicates one mouse. *, P < 0.05; **, P < 0.01; unpaired Student’s t test.

