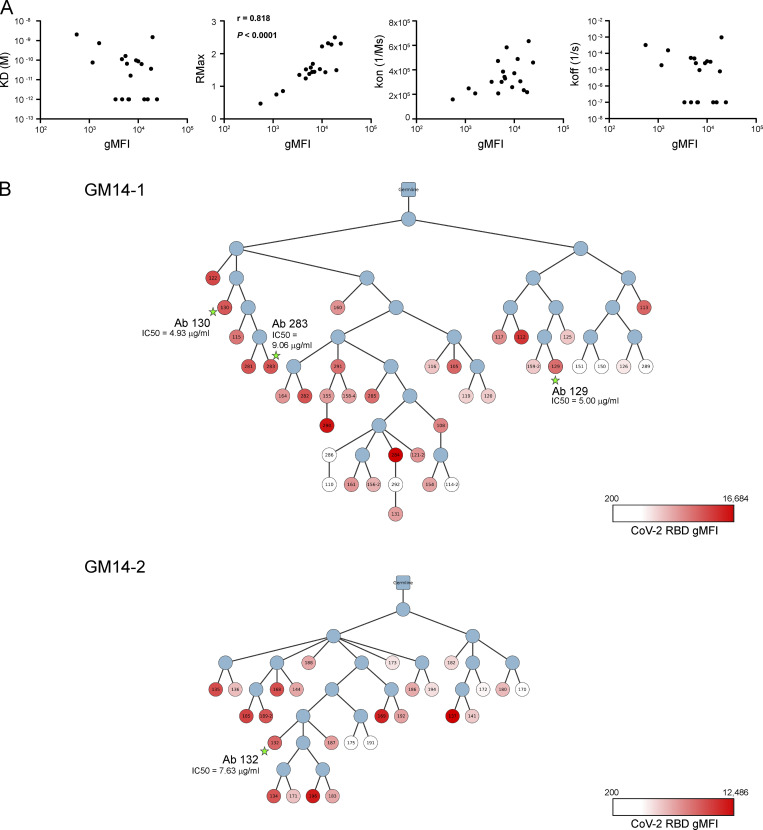
Figure S4.
Reactivity and phylogenetic analysis of mAbs. (A) Correlation between gMFI from bead-based flow-cytometric assay and Rmax from biolayer interferometry (Octet) assay. gMFI and dissociation constant [KD(M)], maximal R (RMax), association rate (kon; 1/ms), and dissociation rate (koff) of bivalent mAb-CoV-2 RBD interactions. Spearman coefficient and P value were calculated by Prism software. (B) The phylogenetic tree of clonal lineages of GC-derived clones from GM14-1 and GM14-2 mice. The root is unmutated germline ancestor. The blue circles are inferred sequences. The white and red colors of the circles indicate the intensity of CoV-2 RBD binding in bead-based flow-cytometric assay (Table S1). The circles with stars are clones with high neutralization activity against CoV-2 (Fig. 5 C).

