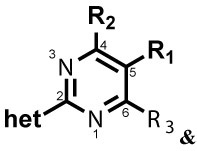
Table 2.
Activities of phenylpyrimidine congeners against somule and adult S. mansoni, their ability to stabilize acetylated tubulin, and mobility measurements by WormAssay.

| |||||||||||||
|---|---|---|---|---|---|---|---|---|---|---|---|---|---|
| Structure | Somules (1 μM)a |
Somules (10 μM)a |
Adults (5 μM)a |
Fold-change in acetylated α- tubulinb |
WormAssay (average adult worm movement ± SD)c (5 μM) |
||||||||
| Cpd# | R1 | R2 | R3 | het | 24 h | 48 h | 24 h | 48 h | 5 h | 24 h | 48 h | 4 h | 5 h |
| 21 |

|

|
Cl |

|
N | N | R, deg | R, deg | N | N | S, on sides | 1.95 ± 0.2 (1 μM) | 75.3 ± 18.9 |
| 22 |

|

|
Cl |

|
R, deg | R, deg | R, deg | R, deg | N | N | Unc | 2.68 ± 0.04 (1 μM) | 131.4 ± 27.4 |
| 23 |

|

|
Cl |
|
Deg, unc | Deg, unc | Deg, unc | Deg, unc | Unc, darkd | Unc, darkd | Unc, darkd | 4.1 ± 0.3 (1 μM) | 62.1 ± 26.4d |
| 24 |

|

|
Cl |
|
N | N | N | Deg, unc | Sd | Unc, on sidesd | S, dark, on sidesd | 2.7 ± 0.2 (10 μM) | 56.0 ± 21.5d |
| 25 |

|

|
Cl |
|
R, S | R, S | R, I | R, I, | I, on sides | I, on sides | I, on sides | 3.0 ± 0.6 (10 μM) | 5.5 ± 9.8 |
| 26 |

|

|
H |
|
R, S | R | R, S | R, S | Sd | Unc, on sidesd | S, dark, on sidesd | NSe | 11.0 ± 14.7d |
| 27 |

|

|
Cl |
|
R, S | R | R, I | R, I | I, on sides | I, on sides | I, on sides | NS | 6.3 ± 9.3 |
| 28 |

|

|
Cl |
|
R, I | R, I | R, I | R, I | I, on sides | I, on sides | I, on sides | NS | 2.9 ± 8.8 |
| 29 |

|

|
Cl |
|
R, S | R, S | R, I | R, I | I, on sides | I, on sides | I, on sides | NS | 5.0 ± 11.5 |
| 30 |

|

|
Cl |
|
S | S, R | R, I | R, I | S, on sides | S, on sides | S, on sides | 2.25 ± 0.51 (10 μM) | 12.9 ± 18.1 |
| 31 | H |

|
Cl |
|
R, unc | N | R, unc | N | N | N | N | NS | 89.0 ± 18.6 |
| 32 |

|
H | Cl |
|
N | N | R, S | N | N | N | N | NS | 78.0 ± 20.1 |
| PZQ | Unc | Unc | Deg | Deg | Deg | D | D | NTf | 1.8 ± 5.1 | ||||
| DMSO | N | N | N | N | N | N | N | 104.1 ± 24.4 | |||||
Descriptors are listed in the footnote to Table 1 and their corresponding severity scores are provided in Scheme 1. Data are from a minimum of two experiments each in duplicate and representative data are shown.
ELISA measured the relative changes in acetylated α-tubulin levels after incubation of HEK293 cells with compound for 4 h. Compounds were assessed in triplicate wells within a single experiment.
WormAssay employed a movie camera connected to a Mac computer and an open source software to record the average motion of adult worms in each well.38, 39
Assays performed at 10 μM.
NS = Non-significant; changes in AcTub levels observed after 4 h of incubation with either 1 or 10 μM of test compound did not reach statistical significance as determined by one-way ANOVA.
NT = not tested
