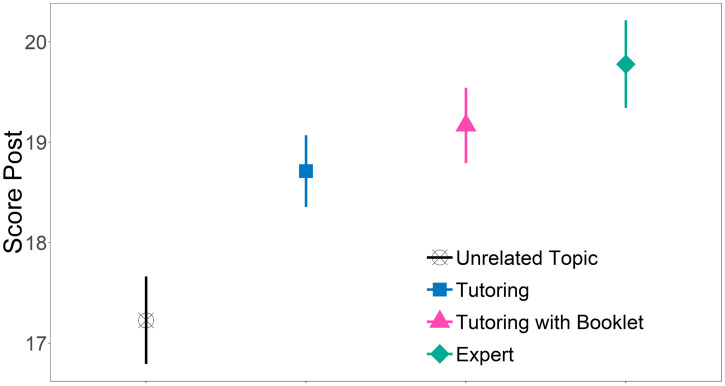
Figure 2.
Score by group for parents. Estimated marginal means for Score Post are represented with different shapes for each group. Bars represent standard errors (SEM). Statistically-significant differences were found between UT and T (P = 0.048), UT and TB (P = 0.006), and UT and E (P < 0.001). This figure appears in color at www.ajtmh.org.

