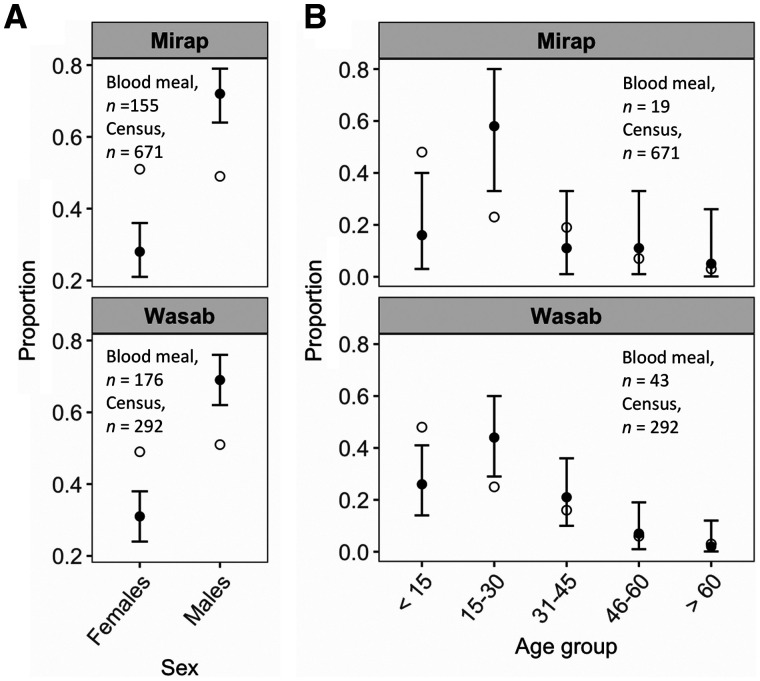
Figure 4.
Results of exact binomial tests comparing the observed and expected blood-meal proportion. (A) Of each sex group in Mirap and Wasab villages. (B) Of each age group in the two villages. The observed blood-meal proportions are represented by black dot with 95% confidence interval bars and the expected proportions are represented by the open circle. The sample size (n) of blood meals and human census count for each village are shown in the plot.

