Figure 4.
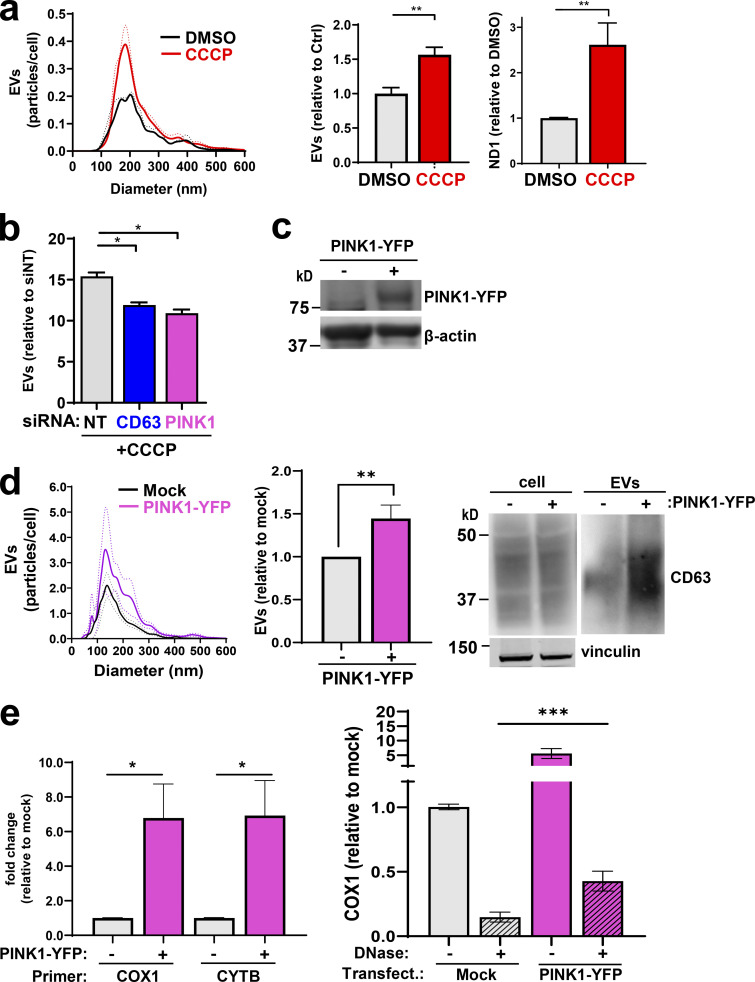
Increased PINK1 levels are linked to EV release. (a) MDA-MB-231 cells were treated with CCCP (10 µM) or control vehicle (DMSO), and released EVs were purified using differential centrifugation and analyzed as in Fig. 2 e. Values represent the mean of three independent experiments; dotted line and error bars represent SEM. **, P < 0.01; t test with Welch’s correction. (b) Cells were transfected with siRNAs targeting CD63, PINK1, or a nontargeting control (siNT) and treated with CCCP (5 µM). EVs were then purified and analyzed by nanoparticle tracking. Values represent the mean ± SEM of three independent experiments. *, P < 0.05; t test with Welch’s correction. (c–e) Cells were transfected with a vector encoding PINK1-YFP or empty vector (mock). EVs were collected from transfected cells and their number, size distribution, and CD63 and mtDNA (both DNase-sensitive and DNase-resistant) content were determined as in Figs. 1 a and 2 d. Values are the mean ± SEM; n = 4 technical replicates. *, P < 0.05; **, P < 0.001; Mann-Whitney U test. In the righthand graph of e, values are mean ± SEM, n = 5. ***, P < 0.001; Wilcoxon test.

