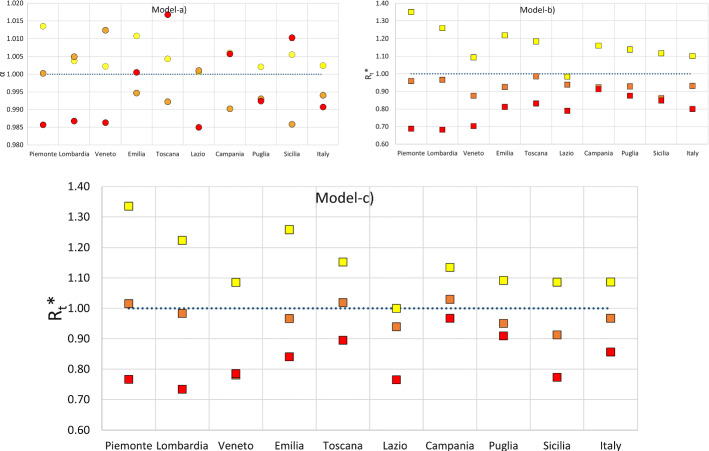
Fig. 6.
Results of the fits for the parameters of the Model-a (upper left plot; what is reported in dots are the fitted estimates of the parameter , Model-b (upper right plot; the fitted estimates of are reported as squares) and Model-c (lower plot; the fitted estimates of are reported as squares) for all the regions and their combination (Italy columns). The colors of the fits, yellow, orange and red, correspond to the three NPI levels. Error bars are smaller than the markers and masked behind them. The horizontal blue dotted lines mark the threshold values and

