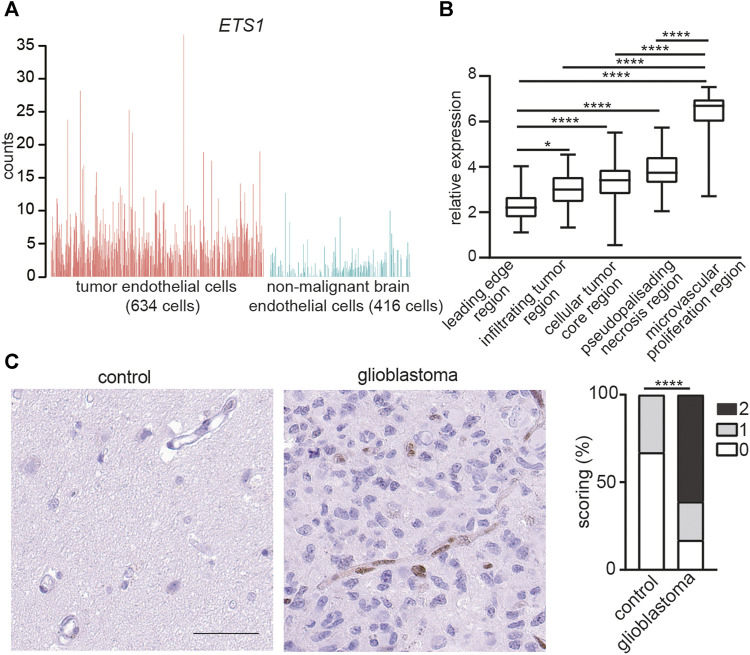
FIGURE 1.
ETS1 is upregulated in tumor endothelial cells in human glioblastoma. (A) Bar plots showing ETS1 expression in tumor endothelial cells (red) and non-malignant brain endothelial cells (blue) (GSE162631). (B) Expression of ETS1 in Ivy GAP RNA-seq of distinct GBM anatomic structures (One-way ANOVA with Tukey’s multiple comparisons test; *p < 0.05, ****p < 0.0001). (C) Immunohistochemical staining and quantification of ETS1 in human GBM and paired non-malignant brain tissue (bar: 50 μm) (n = 18, Mann-Whitney test, ****p < 0.0001).

