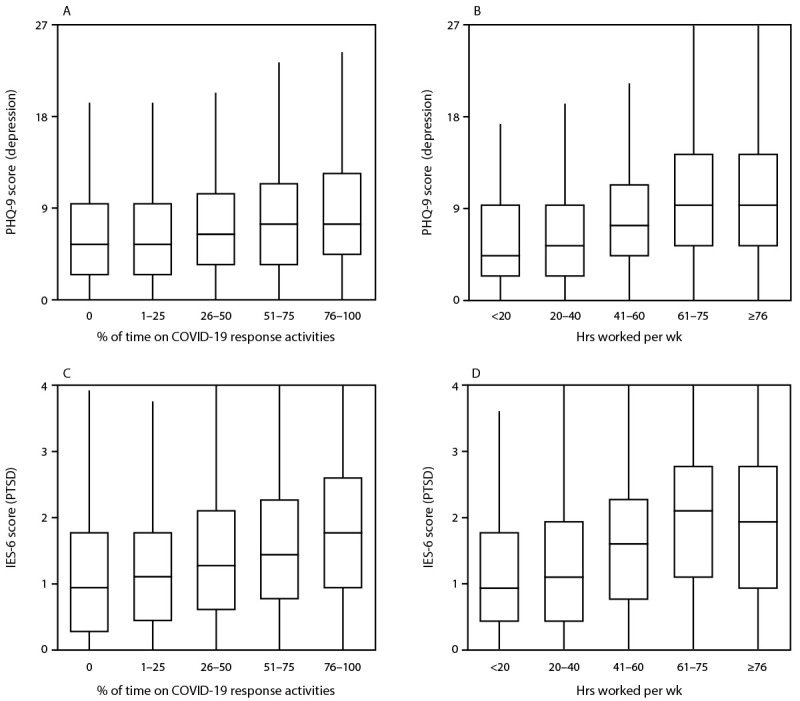
FIGURE.

Distribution* of 9-item Patient Health Questionnaire scores for depression and 6-item Impact of Event Scale scores for post-traumatic stress disorder† among state, tribal, local, and territorial public health worker respondents,§ by percentage of work time spent directly on COVID-19 response activities for the majority of 2020 (panels A, C), and hours worked in a typical week since March 2020 (panels B, D) — United States, March–April 2021
Abbreviations: IES-6 = 6-item Impact of Event Scale; PHQ-9 = 9-item Patient Health Questionnaire; PTSD = post-traumatic stress disorder.
* Upper and lower levels of boxes indicate 75th and 25th percentiles, respectively; horizontal line indicates median; whiskers indicate observation nearest to 1.5 × interquartile range.
† Self-reported symptoms of depression or PTSD were evaluated; respondents who scored ≥10.0 out of 27 on the PHQ-9 for depression or ≥1.75 out of 4 on the IES-6 for PTSD were considered symptomatic for the respective conditions.
§ Only public health worker respondents who completed all PHQ-9 items (n = 22,692) or all IES-6 items (n = 22,248) are included.
