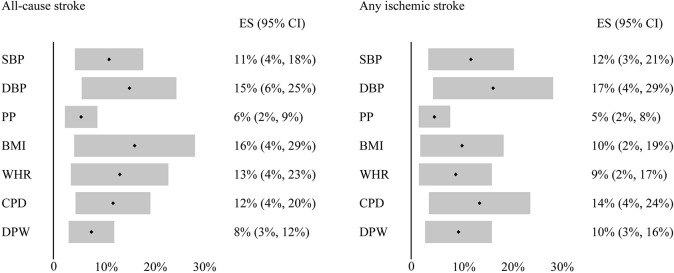
FIGURE 3.
Mediation analysis of the effect of television watching on all-cause stroke and any ischemic stroke. Black dot indicates the average proportion, and gray bar indicates the 95% confidence intervals. ES, estimate for certain factor mediating the effect of television watching on stroke outcomes; CI, confidence interval; CPD, cigarettes per day; DPW, drinks per week.

