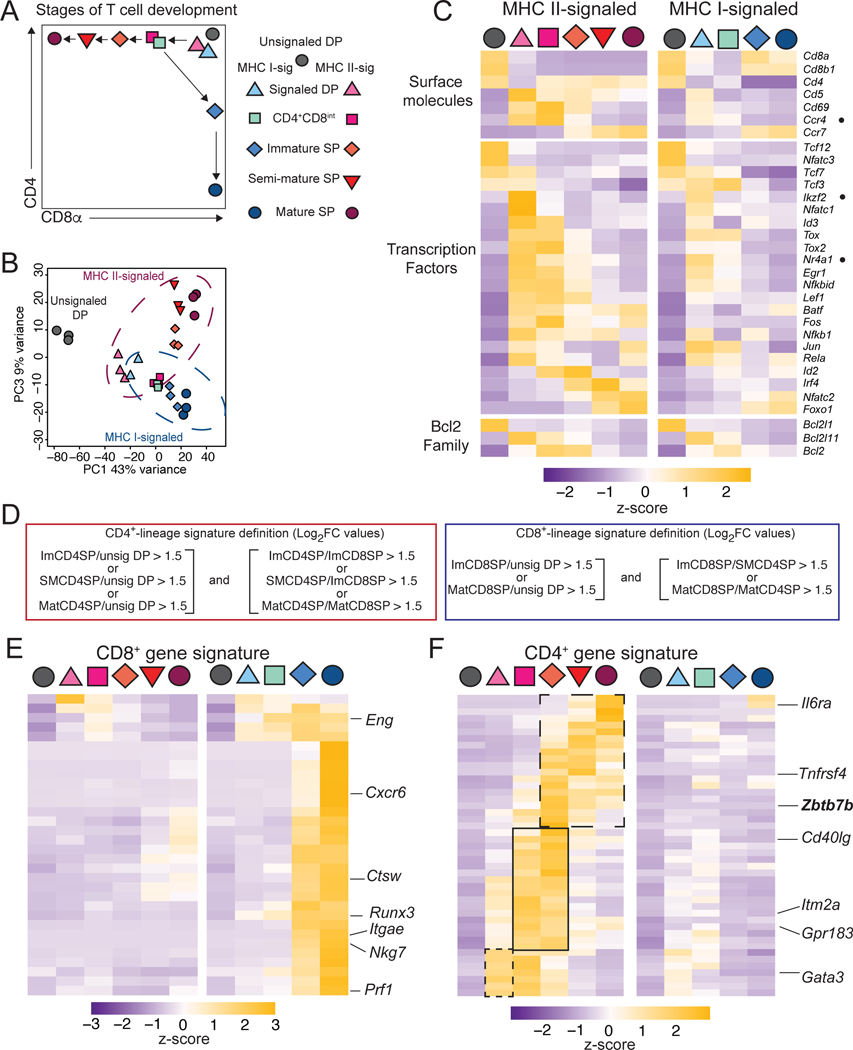
Figure 1: Transcriptomic analyses of thymocyte subsets.
(A) Populations sorted for RNA-seq analyses. Unsignaled (grey) MHC I- (blue) and MHC II- (red) signaled subsets are shown on a schematic CD4-CD8 expression plot.
(B) PCA displays cell subsets according to PC1 and PC3. Each symbol represents an individual biological replicate.
(C) Heatmap shows row-standardized (Z-scores of reads per million [RPM] values) mRNA expression in populations identified as defined in (A).
(D) Definition of CD4+ and CD8+ signature genes shown in (E,F).
(E, F) Heatmaps (as in [C]) of CD8+- (E) and CD4+- (F) lineage signature gene expression. CD4+ signature genes differing by their kinetics of expression are boxed (F).
See also Figure S1

