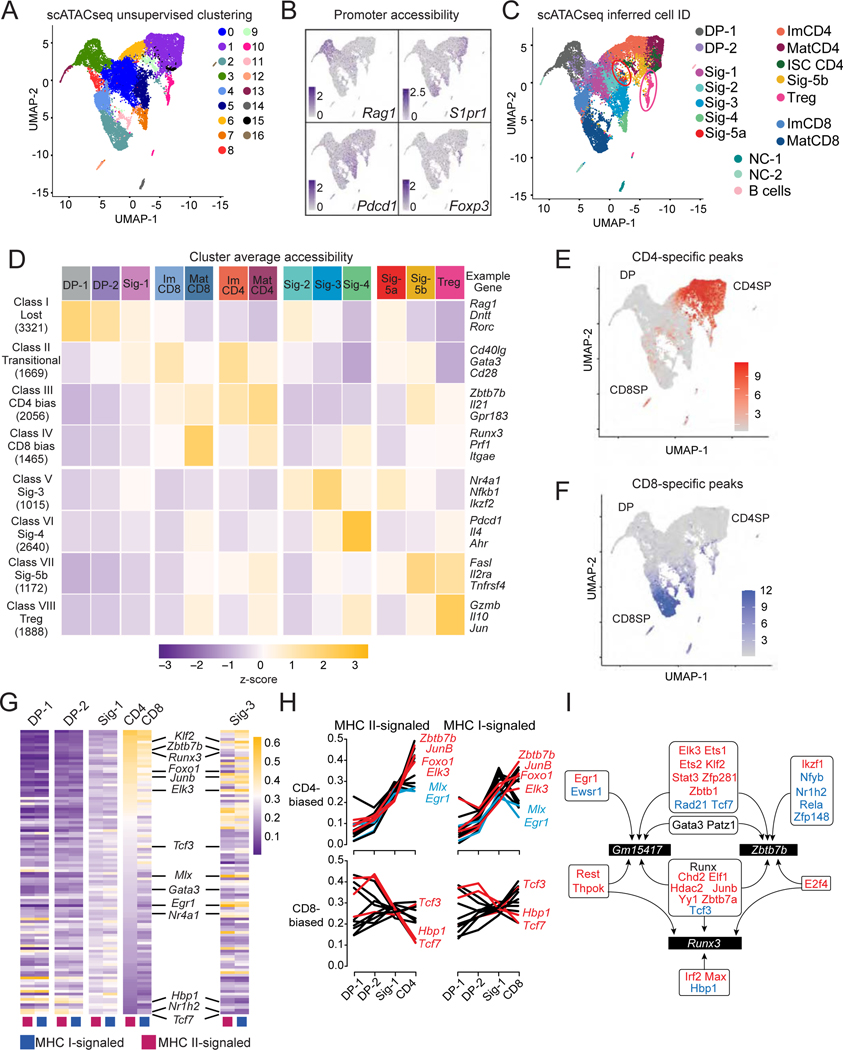
Figure 3: Single cell ATACseq analyses.
(A-J) MHC I- and MHC II-signaled thymocytes were prepared as in Fig. S2AB for scATACseq. Data integrates two biological replicates from each genotype.
(A) UMAP plot displays thymocytes color-coded according to their cluster distribution.
(B) UMAP plots shows scaled accessibility scores at promoter (2 kb segment upstream of transcription start site) of indicated genes.
(C) UMAP plot shows cells color-coded according to scRNAseq-based IID. NC = non-conventional. Circles denote Sig-5a (red) and Tregs (pink).
(D) Heatmap shows row-standardized accessibility of 15,226 OCR differentially accessible between any two IID-defined cell groups (columns) and classified by K-means clustering (rows). Gene assignment of OCRs performed by Homer; example genes are indicated.
(E, F) UMAP plot shows scaled accessibility scores for individual cells at CD4+- and CD8+-lineage specific peaks.
(G) Heatmap shows gene set expression scores for each of the 106 CellOracle defined transcription factor activities (TA) (rows) in MHC I- and MHC II-signaled cells from indicated clusters (columns). TA are ranked by decreasing score in MHC II-signaled ImCD4 cells.
(H) Line graphs depict the scores of the top 15 significantly CD4+-biased (top) and the 12 significantly CD8+-biased TA (bottom) across MHC II-signaled (left) and MHC I-signaled (right) DP-1, DP-2, Sig-1, ImCD4 and ImCD8 cells.
(I) Schematic showing transcription factors predicted by CellOracle and AU cell to bind the Runx3 or Zbtb7b locus (including Zbtb7b and Gm15417). Red and blue font indicate factors identified as CD4+- and CD8+-biased, respectively. Gata3, Runx factors and Patz1 (Mazr), identified as neither CD4+- nor CD8+-biased, were previously shown to bind Zbtb7b and Gm15417 (see text for references). Arrows indicate predicted binding.
See also Figures S2–3 and Tables S3–S6

