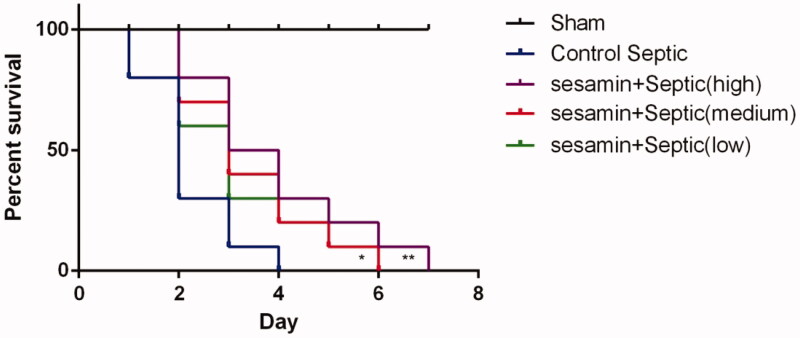
Figure 1.
Effect of sesamin on survival in sepsis. (A) Survival curves were generated by the Kaplan–Meier method. The horizontal line represents the sham group. The blue solid line represents the control sepsis group, the green line represents the sesamin (25 µM) + sepsis group, the red line represents the sesamin (50 µM) + sepsis group, and the purple line represents the sesamin (100 µM) + sepsis group. The data are presented as the mean ± SD (*p < 0.05; **p < 0.01, n = 10 in each group). Three independent experiments were performed for all tests.

