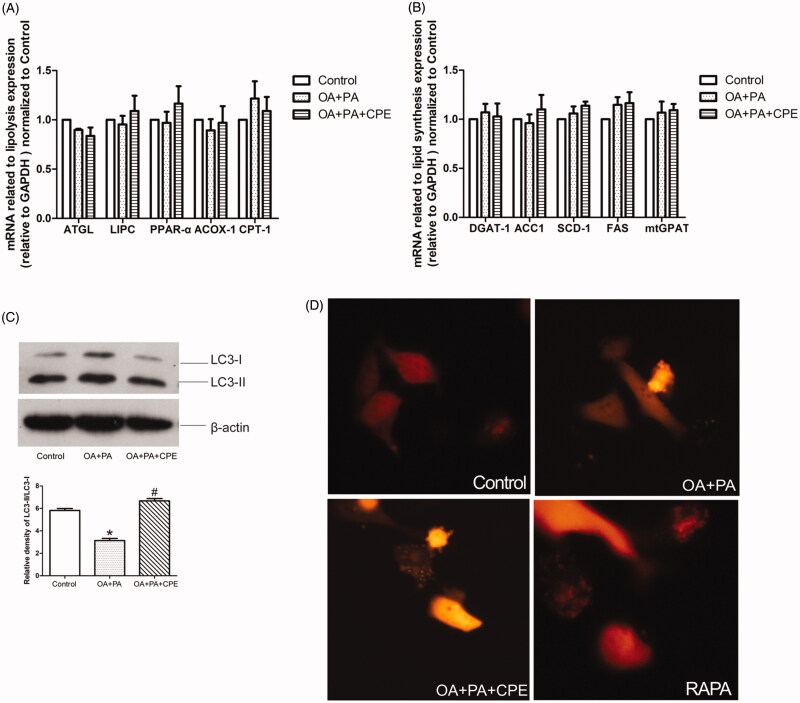
Figure 2.
CPE-induced lipid clearance was temporally coupled with an increase in LC3 expression without affecting the classical lipolysis and lipid synthesis pathway. (A, B) The data showed mRNA levels of genes regulating lipolysis and lipid synthesis in HepG2 cells, which were treated with 0.5 mM of OA and PA mixture for 16 h, followed by 24 h post-treatment with 50 μg/mL of CPE, compared to OA + PA mixture-treated cells and no lipid-treated cells (control group). Values are presented as means ± SDs (n = 6). (C) Representative immunoblotting and densitometric analysis showing LC3-II accumulation in HepG2 cells treated with 50 μg/mL of CPE for 24 h vs. non-treated cells and OA and PA mixture treated cells. *p < 0.05 vs. control group, #p < 0.05 vs. OA and PA mixture treated cells (n = 3). (D) Representative image of autophagosomes in RFP-tagged LC3 plasmid-transfected HepG2 cells treated with 0.5 mM of OA and PA mixture for 16 h, followed by 24 h of 50 μg/mL of CPE treatment or 1 μM of rapamycin vs. OA and PA mixture-treated cells and control group (n = 3).

