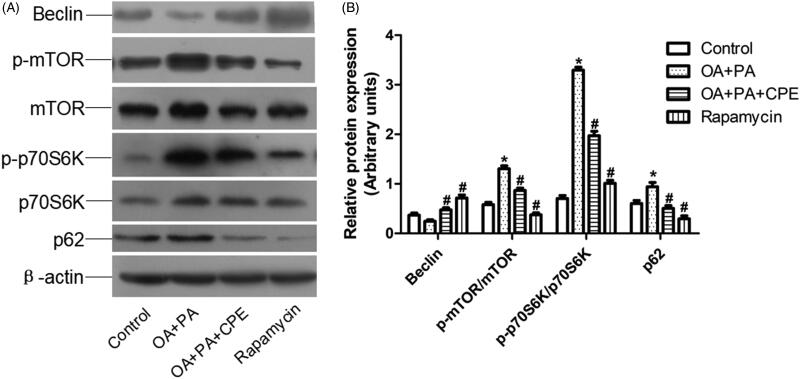
Figure 3.
Expression of autophagy-regulated protein in HepG2 cells. (A) Protein expression involved in mTOR signalling pathway of HepG2 cells treated with 50 μg/mL of CPE or 1 μM of rapamycin for 24 h, after 0.5 mM of OA and PA mixture treatment for 16 h vs. OA + PA mixture treated cells and no lipid-treated cells (n = 4). (B) Densitometric analyses of the protein expressions normalized to β-actin. The statistical analyses were performed using one-way analysis of variance followed by Newman–Keuls post-hoc tests. Rapamycin was used as an autophagy inducer. *p < 0.05 vs. no lipid-treated cells, #p < 0.05 vs. lipid mixture treated cells. The data are presented as means ± SDs (n = 4).

