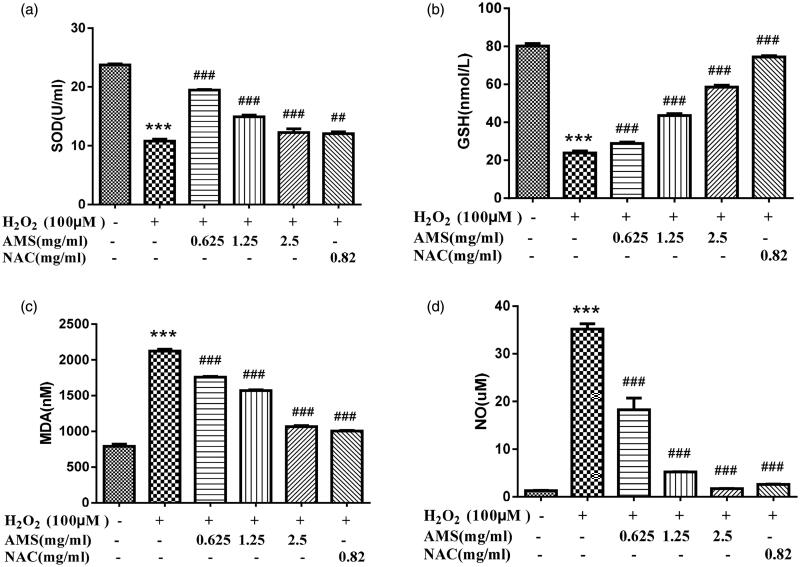
Figure 5.
Effects of AM on superoxide dismutase (SOD), glutathione (GSH), malondialdehyde (MDA), and nitric oxide (NO) cellular levels in the model of H2O2 (100 µmol/L) induced oxidative stress. (a) SOD; (b) GSH; (c) MDA; (d) NO. Values are presented as mean ± SD from three samples and were analysed using one-way ANOVA followed by an LSD test. **p < 0.01 and ***p < 0.001 compared to the control group, ##p < 0.01 and ###p < 0.001 compared with the HSCs that received H2O2 alone.

