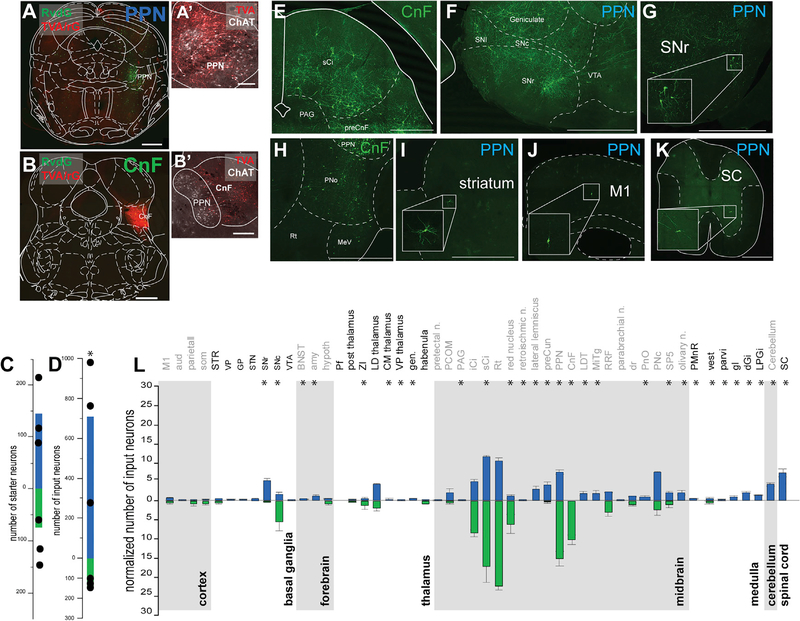
Figure 3. Whole-brain inputs to PPN and CnF glutamatergic neurons.
(A–D) Following injection of helpers (mCherry, red) and rabies virus (YFP, green) in the PPN (A) and the CnF (B) defined using ChAT staining (A′ and B′), we quantified the number of starter neurons (PPN: 145.33 ± 40.19, CnF: 74.66 ± 24.91; t test: t(4) = 1.49, p = 0.21047) (C) and the number of input neurons across all brain areas (raw: PPN: 708.91 ± 242.25, CnF: 143.33 ± 12.17, t test: t(4) = 2.33, p = 0.0401; normalized: PPN: 4.73 ± 1.27, CnF: 2.28 ± 0.94 input/starter, Mann-Whitney: Z = 1.964, p = 0.0495) (D). Due to the higher number of RvdG-labeled neurons following injection in the PPN compared with the CnF, the signal intensity was focused on the YFP signal for the PPN and the mCherry signal for the CnF (coronal plane).
(E–K) Fluorescent micrographs of representative areas where input neurons were identified, including the dorsal brainstem (E) and the pons (H) following a CnF injection and the ventral midbrain (F and G), the striatum (I), the cortex (J), and the spinal cord (K) following a PPN injection.
(L) Quantification of the number of input neurons projecting to PPN (blue) and CnF (green) glutamatergic neurons for each brain area normalized by the overall total number of input neurons per animal (Wilcoxon test).
*p < 0.05. All experiments have been replicated in at least 3 mice. A single datum is represented by a small dot. All data are represented as mean ± SEM. Scale bars: (A and B) 500 μm, (A′) 100 μm, (B′) 250 μm, (E–K) 1,000 μm.

