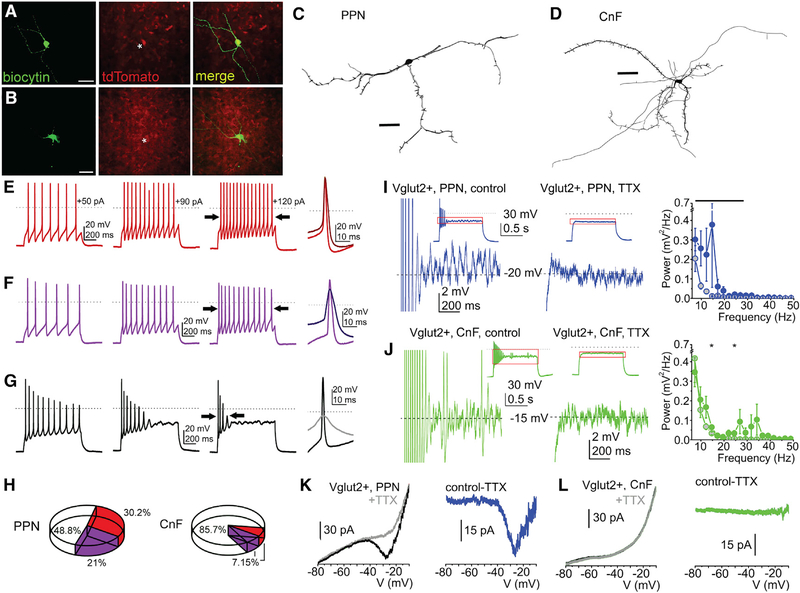
Figure 4. Functional and morphological differences of PPN and CnF glutamatergic neurons.
(A and B) Fluorescent micrographs of PPN and CnF glutamatergic neurons obtained from VGLUT2-tdTomato mice following biocytin labeling.
(C and D) Reconstruction of representative glutamatergic neurons in the PPN (C) and the CnF (D) in the coronal plane, which were subsequently used to quantify the number of proximal dendrites, nodes, and endings (Table S2).
(E–G) Changes of spike frequency adaptation by increasing depolarizing steps revealed functional subtypes of glutamatergic neurons defined as follows: (E) non-adapting, or less than 50% increase in the adaptation index of the action potential trains obtained with 50 and 120 pA current injections; (F) slowly adapting, or more than 50% change of the adaptation index but fired during the whole 1 s-long depolarizing step; and (G) rapidly adapting, or paused firing after application of greater depolarizing steps.
(H) Proportion of neurons with different spike frequency adaptation properties in the PPN and the CnF.
(I and J) Voltage traces from glutamatergic neurons in the PPN (I) and the CnF (J) representing high-threshold oscillations during 120 pA depolarizing square current injections under control conditions (left) and following TTX application (right; red squares of the small inserts indicate the magnified area). Related power spectra are displayed on the left (average ± SEM; PPN control, black circles; PPN+TTX, gray circles with black contours; CnF control, red circles; CnF+TTX, gray circles with red contours).
(K and L) Representative current traces from neurons in the PPN (K) and the CnF (L) elicited by voltage ramp injections under control conditions (black) and with TTX (gray; left). TTX-sensitive currents are shown in the right panels (PPN, blue; CnF, green).
*p < 0.05. All experiments have been replicated in at least 3 mice. Group value and statistics are provided in Table S2. All data are represented as mean ± SEM. Scale bars: (A and B) 0.5 mm, (C and D) 50 μm.

