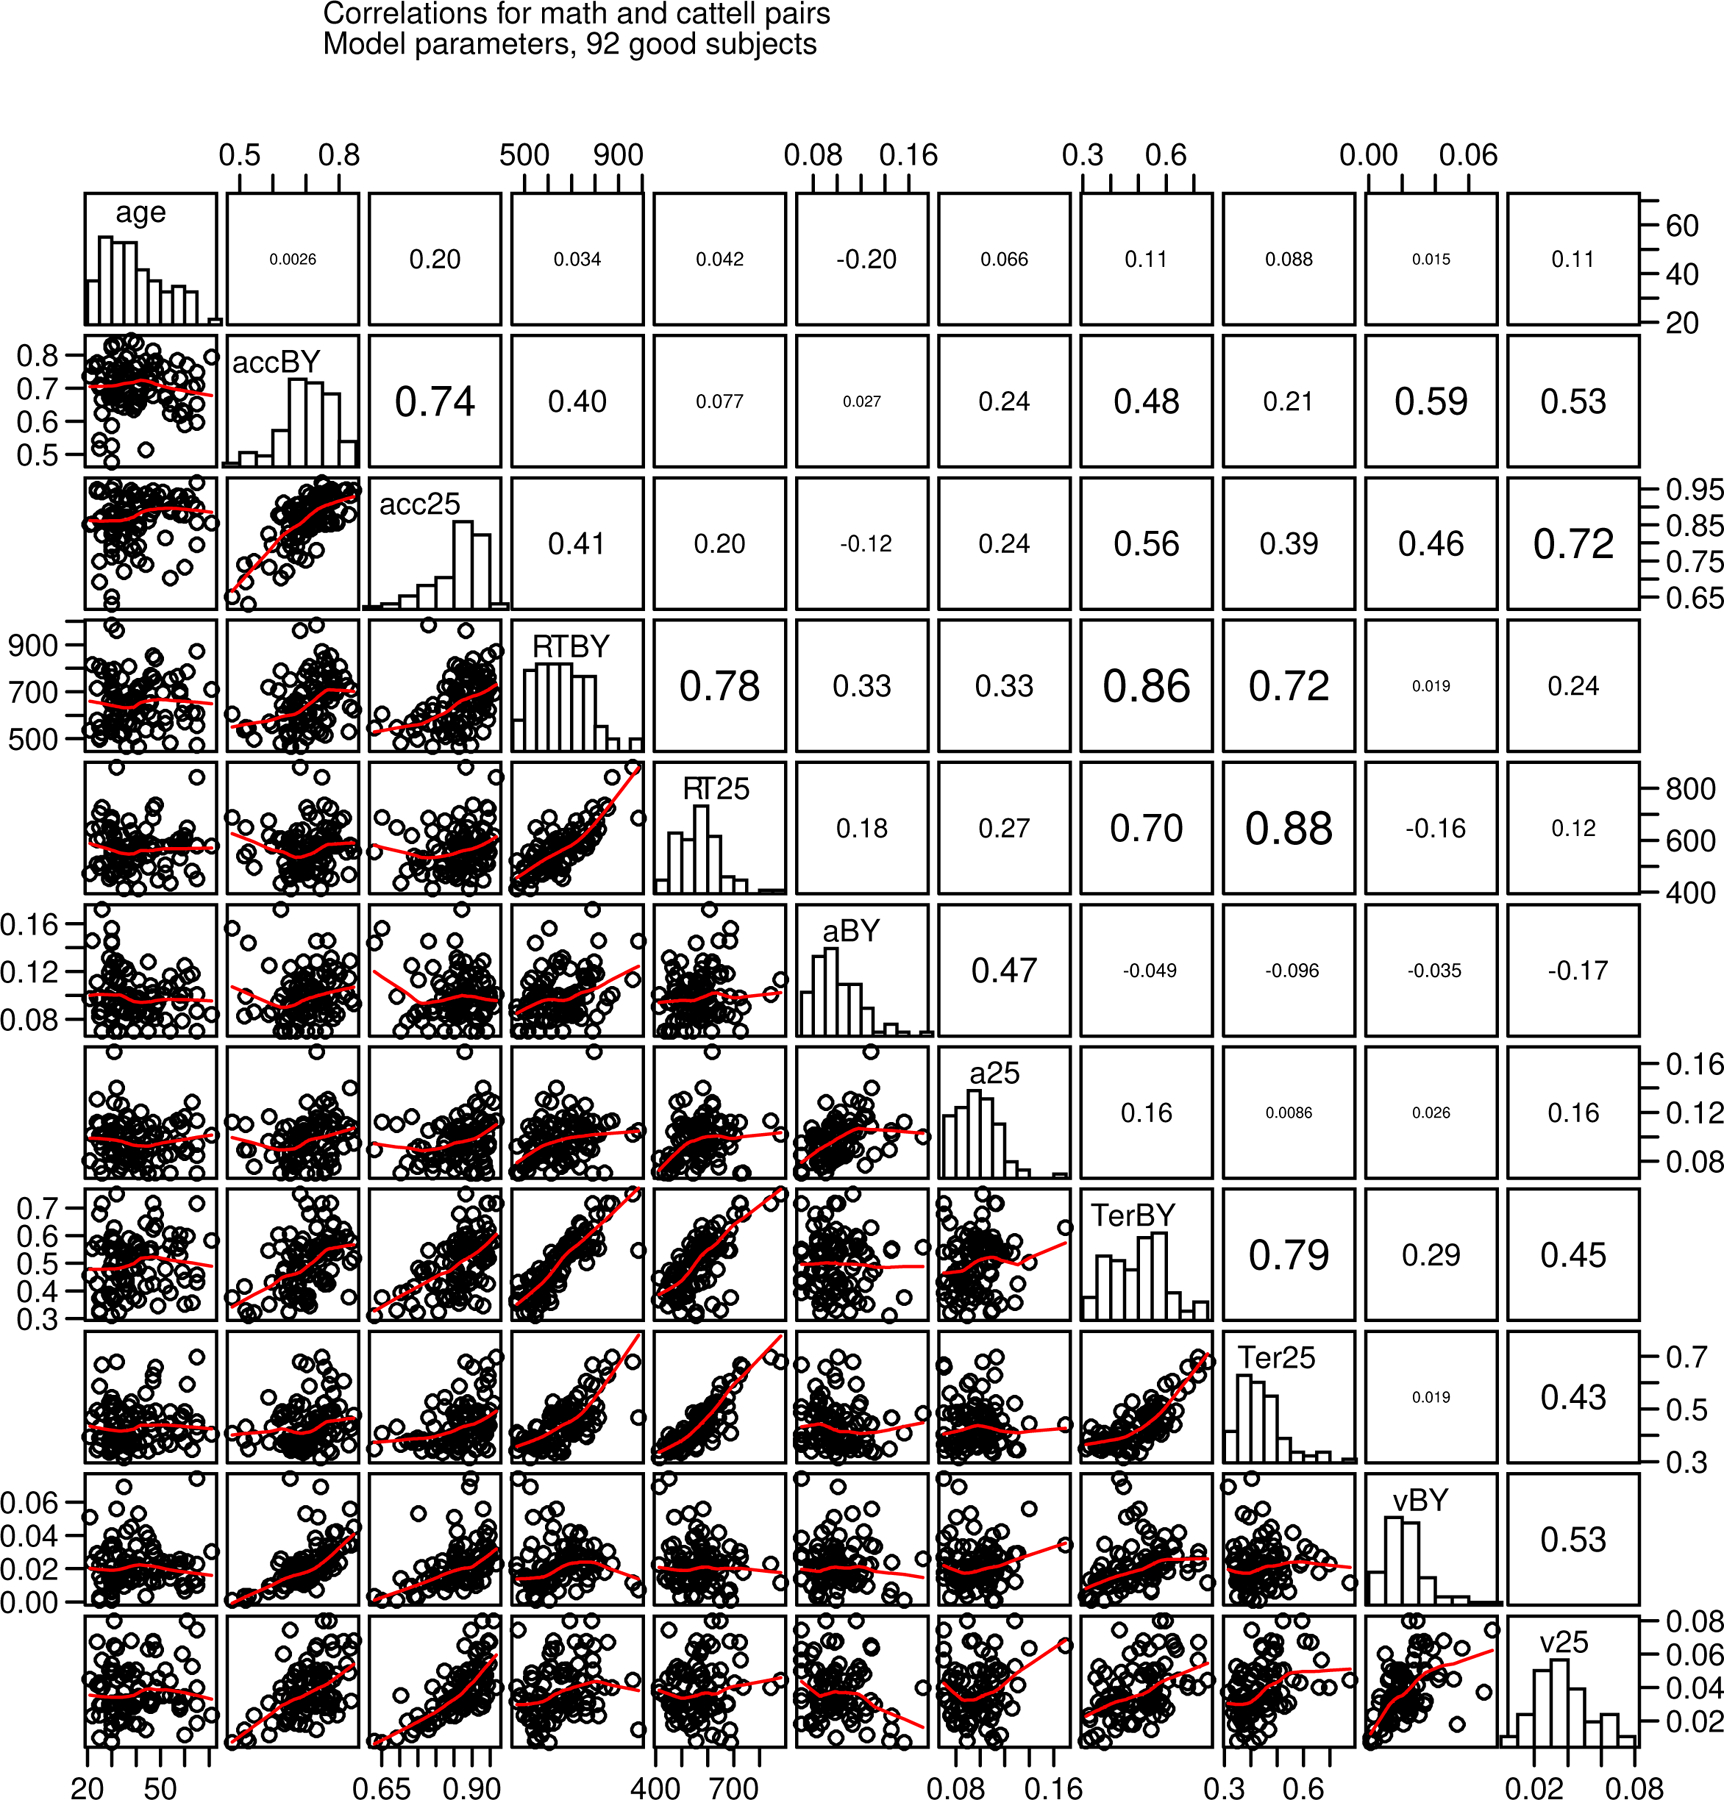
Figure 11.

Scatter plots, histograms, and correlations for age, accuracy and mean RT, and diffusion model parameters, nondecision time, boundary separation, and drift rate averaged over conditions for the 92 “good” subjects for the two numerosity discrimination tasks. acc=accuracy, RT=mean RT, a=boundary separation, Ter=nondecision time, v=mean drift rate, BY is the blue/yellow task, and 25 is the Y25 task.
