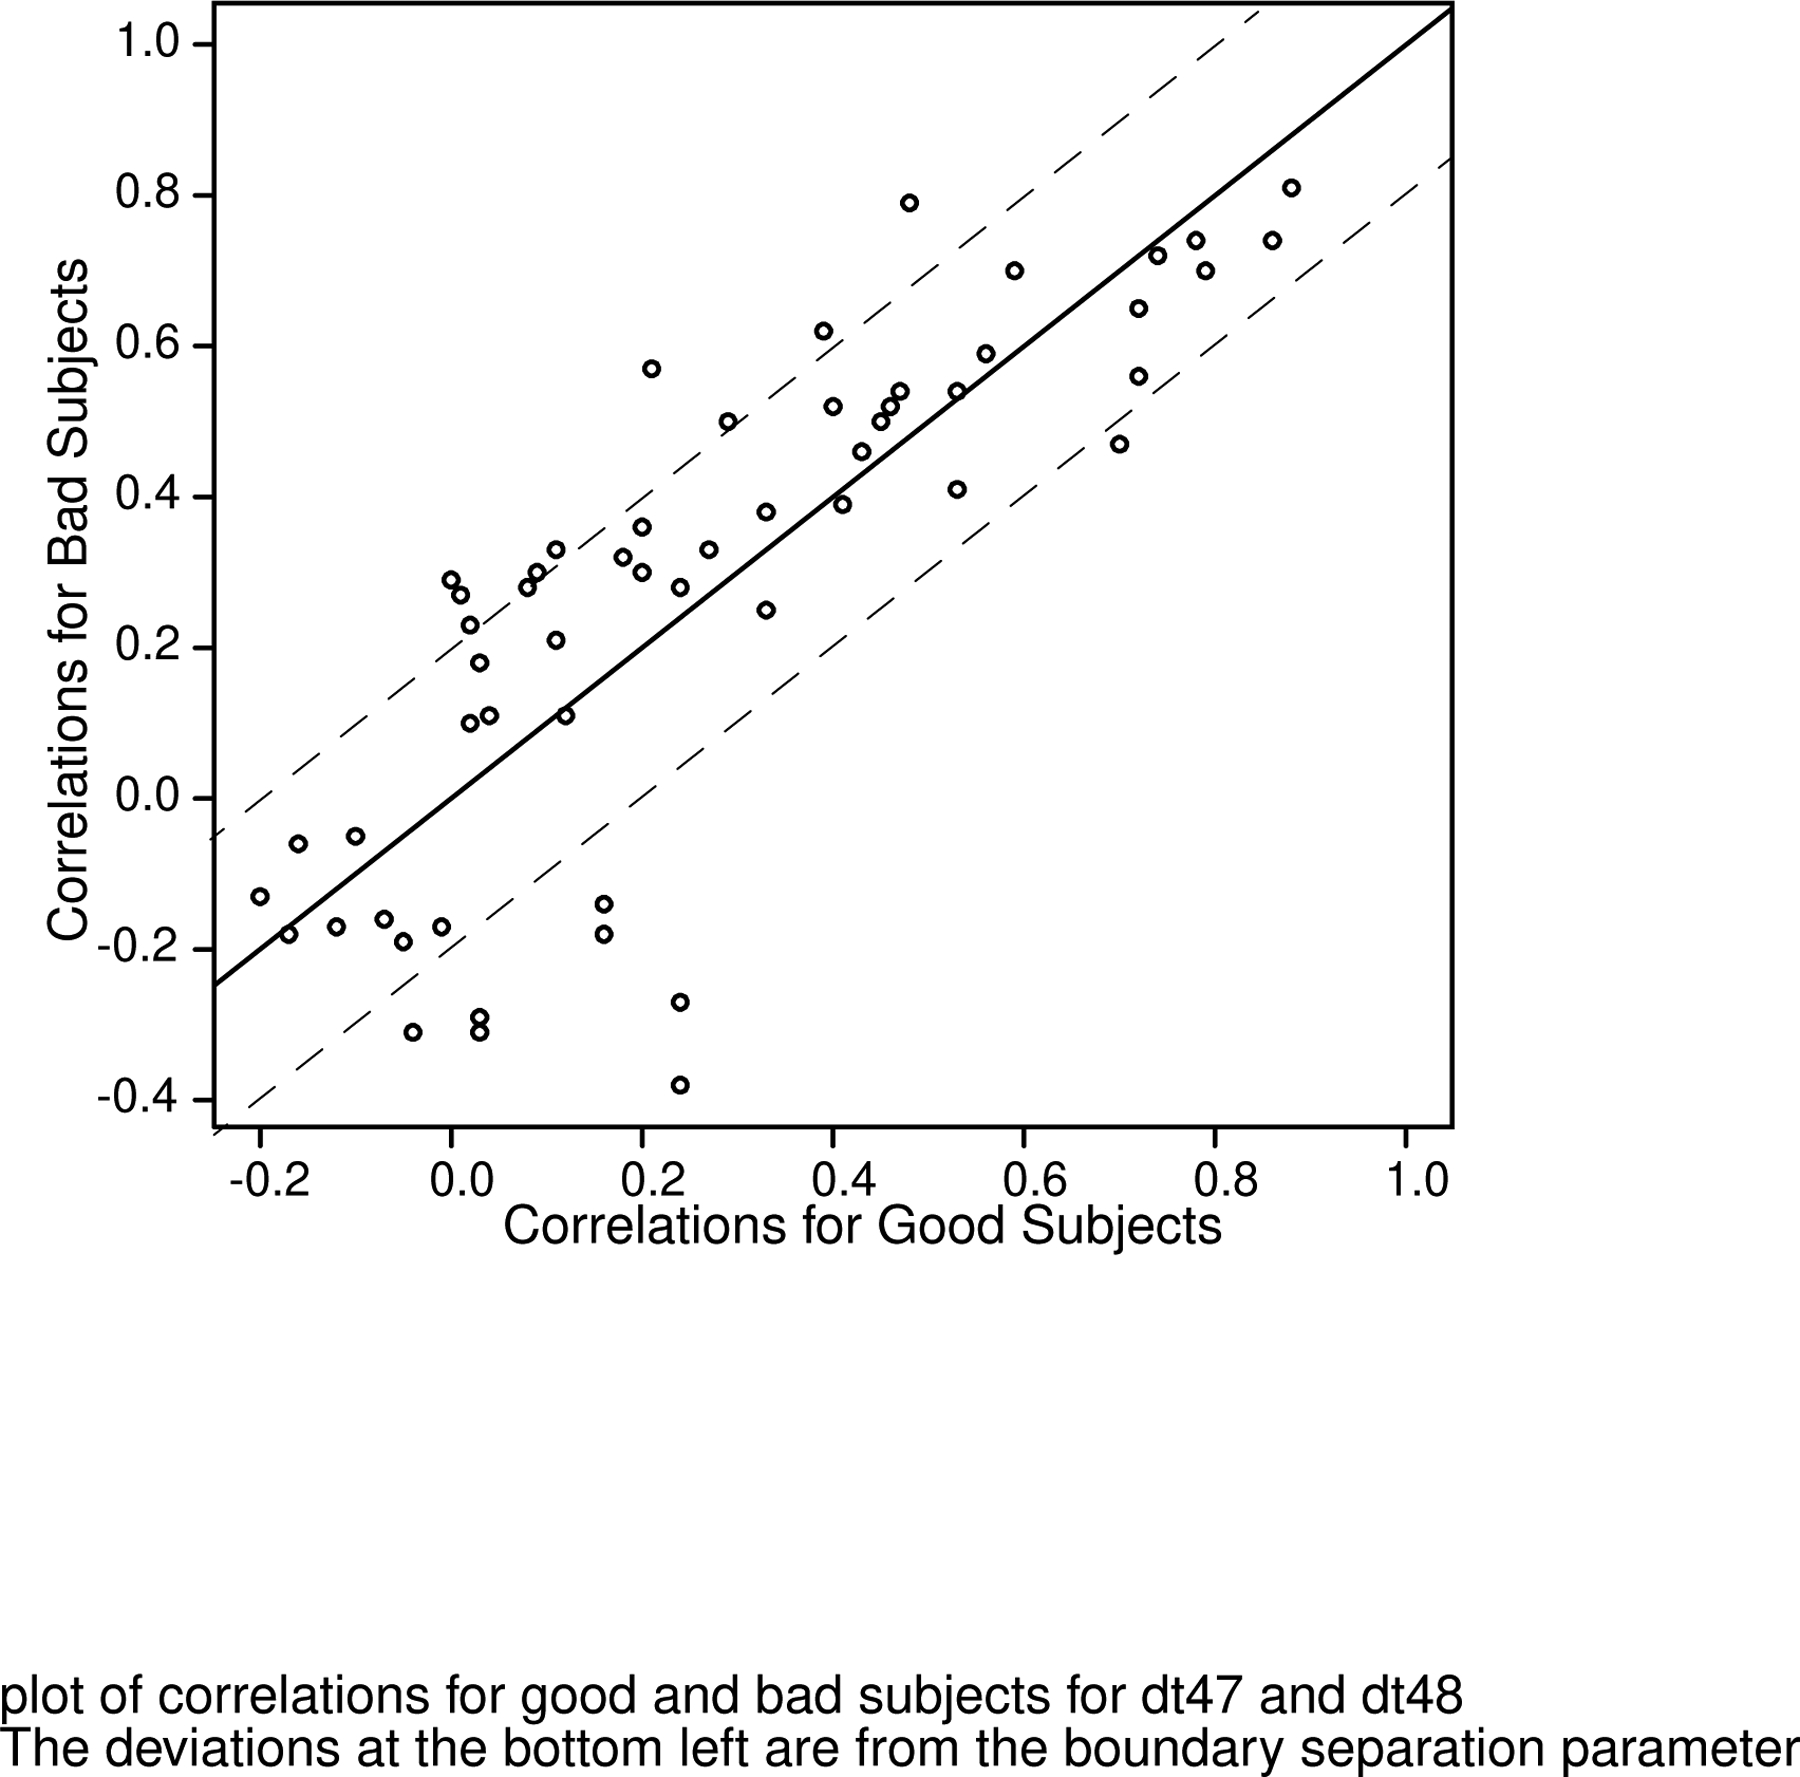
Figure 12.

Plots of the correlation coefficients from Figure 10 (above the diagonal) against the same correlations for the “bad” subjects. The dashed lines are parallel to the line with slope 1 and are values of the correlation 0.2 above that line and 0.2 below it.
