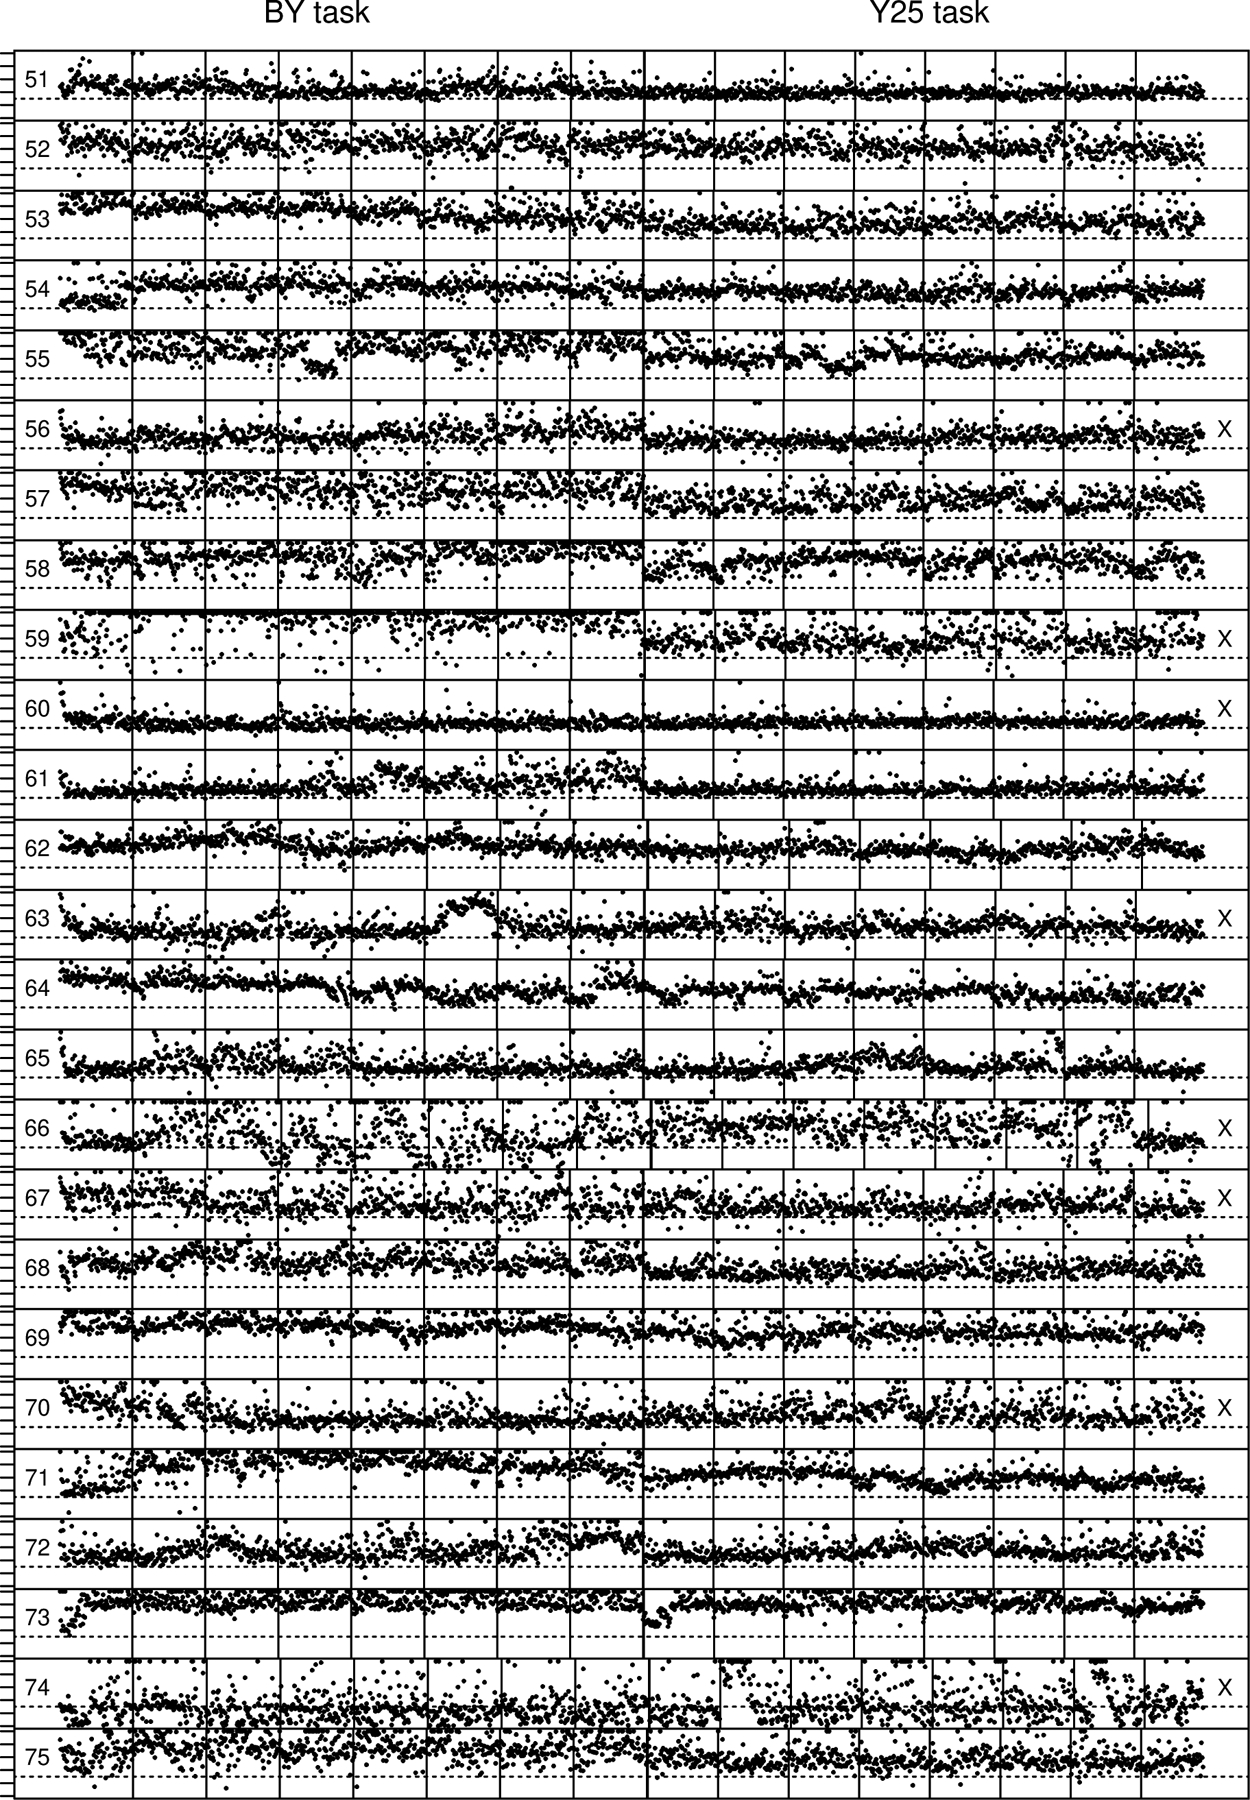
Figure 13.

Plots of every RT across the session for the BY and Y25 tasks (see Figure 5). The numbers on the left are the subject number in the order analyzed and the “x” on the right denotes “bad” subjects. The dashed horizontal line is at 300 ms and serves as an approximate way of identifying fast guesses and long RTs greater than 1000 ms are replaced by 1000 ms.
