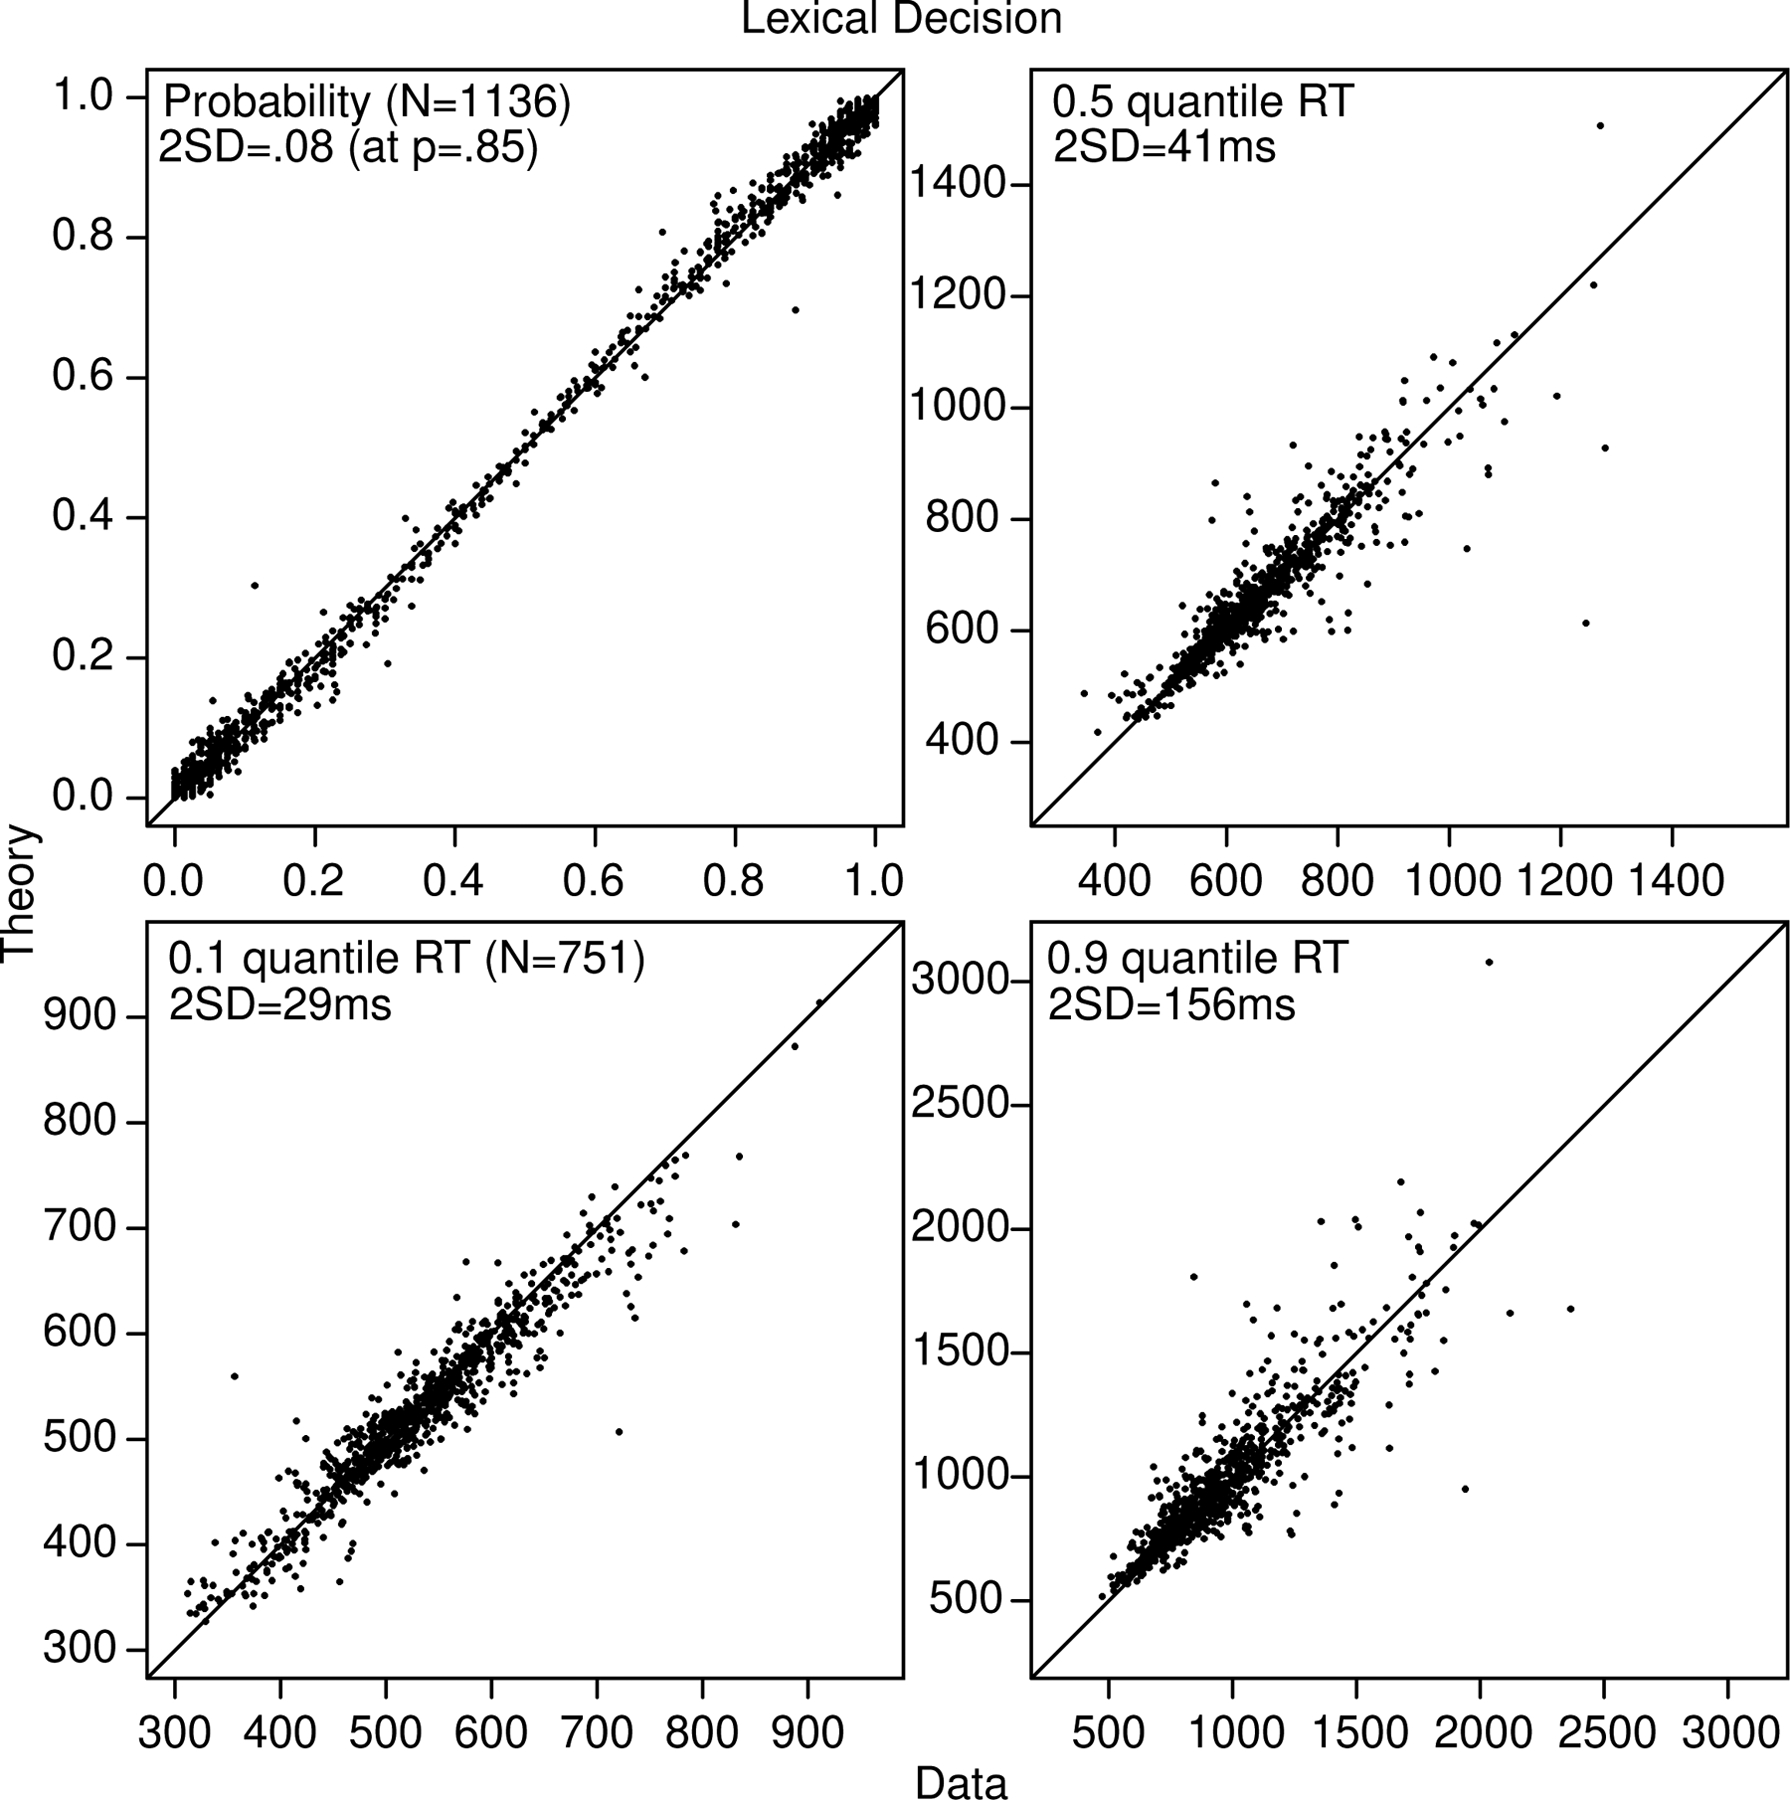
Figure 2.

Plots of accuracy, the 0.1, 0.5 (median), and 0.9 quantile correct response times (RTs) for every subject and every condition for the lexical decision task. For the quantiles, only values are presented from conditions with over 15 observations. The two SDs in the quantile RTs are computed from a bootstrap method, and for probability (that plots both correct and error probabilities and so has redundancy), they are based on binomial probabilities.
