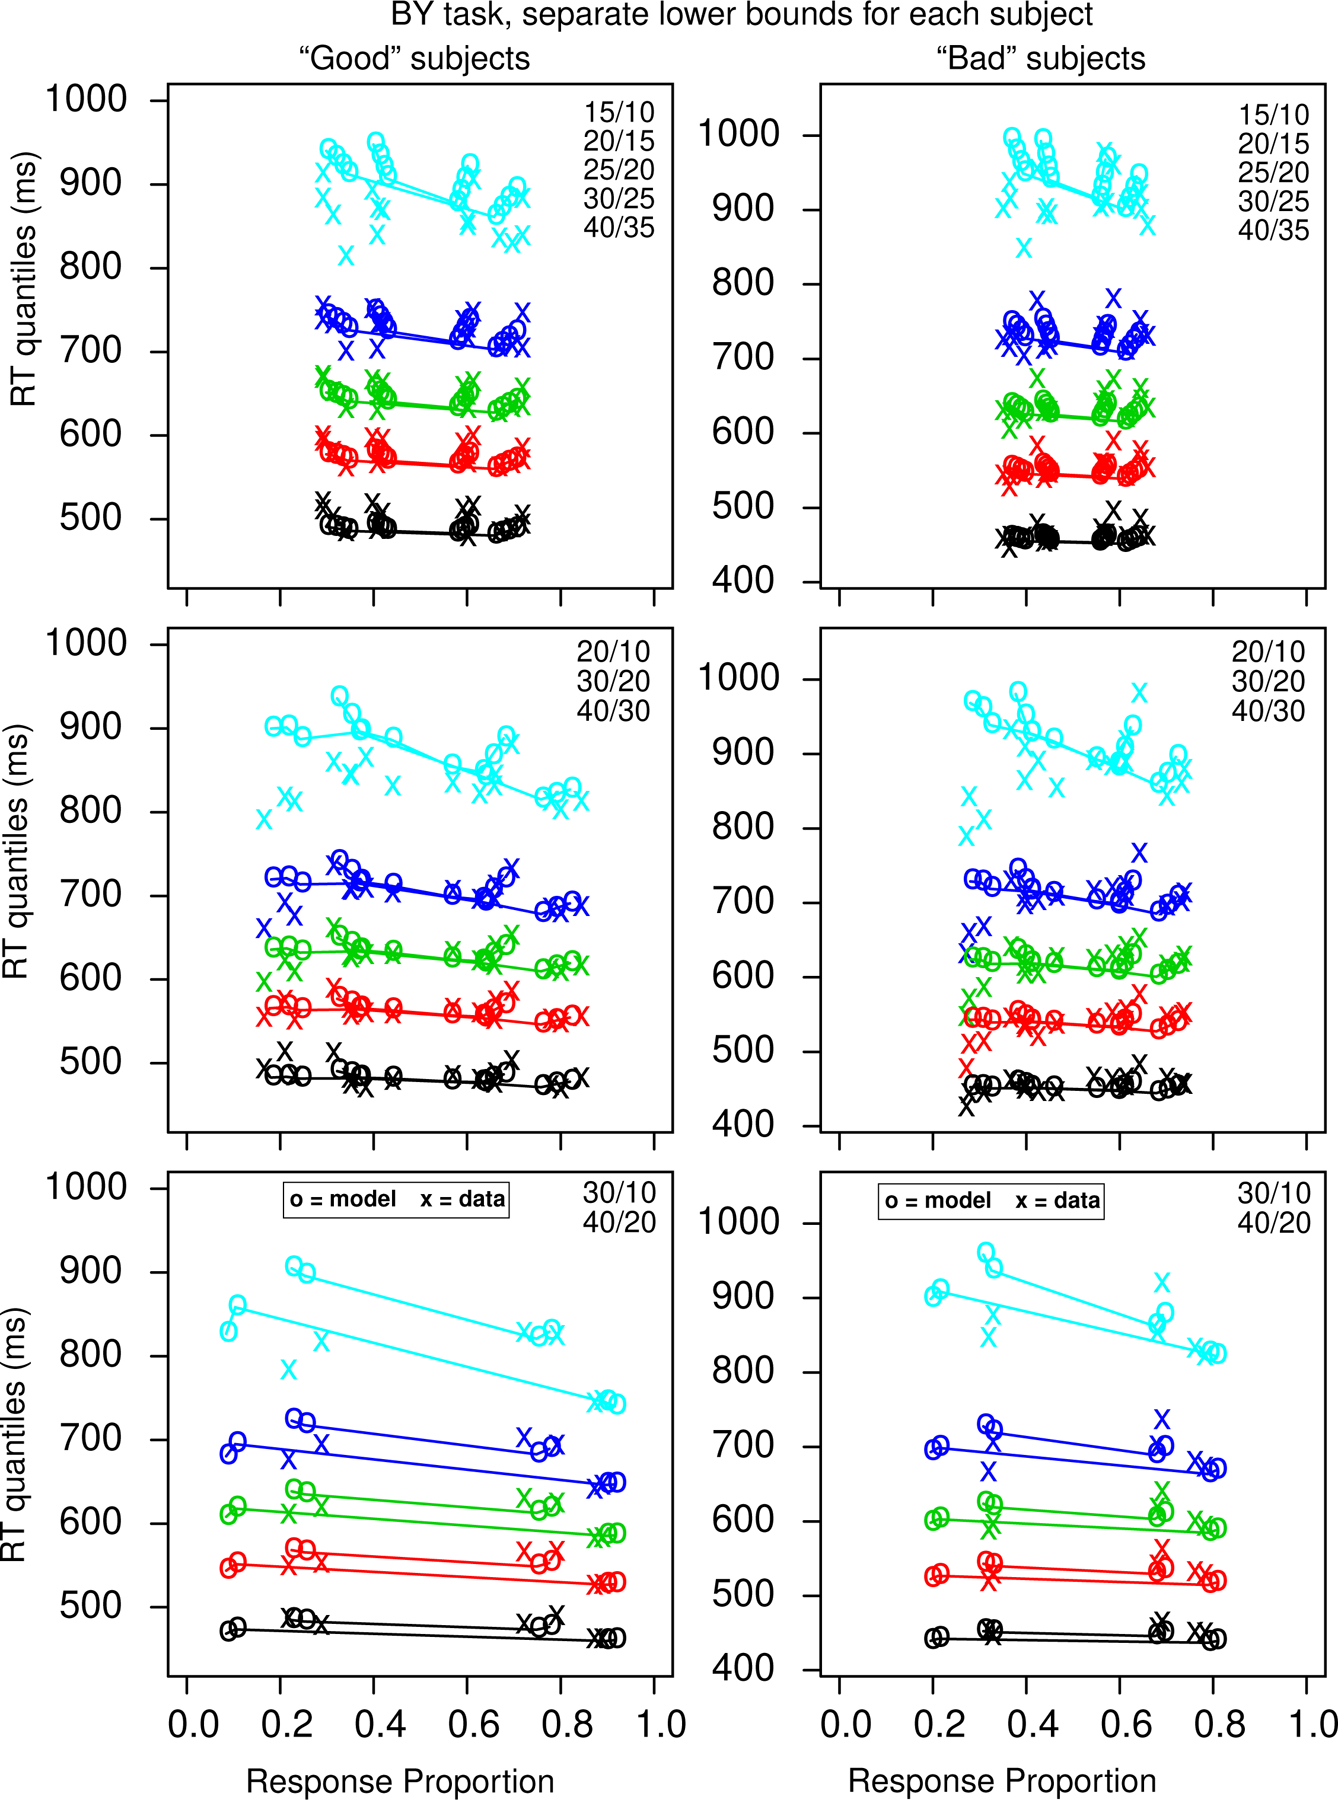
Figure 7.

Quantile-probability functions for the BY task for the “good” subjects, left column, and “bad” subjects, right column. These plot RT quantiles against response proportions (correct responses to the right of 0.5 and errors to the left). The green/central lines are the median RTs. The number of dots in the conditions in the plots is shown in the top right corner, with the top one in each condition corresponding to the right-hand point in the plot. The more extreme functions are for proportional-area conditions, and the less extreme for equal-area conditions. In a number of cases for the difference of 20 conditions, some subjects had no errors which means that those error quantile RTs (for data) could not be computed and so are not plotted.
