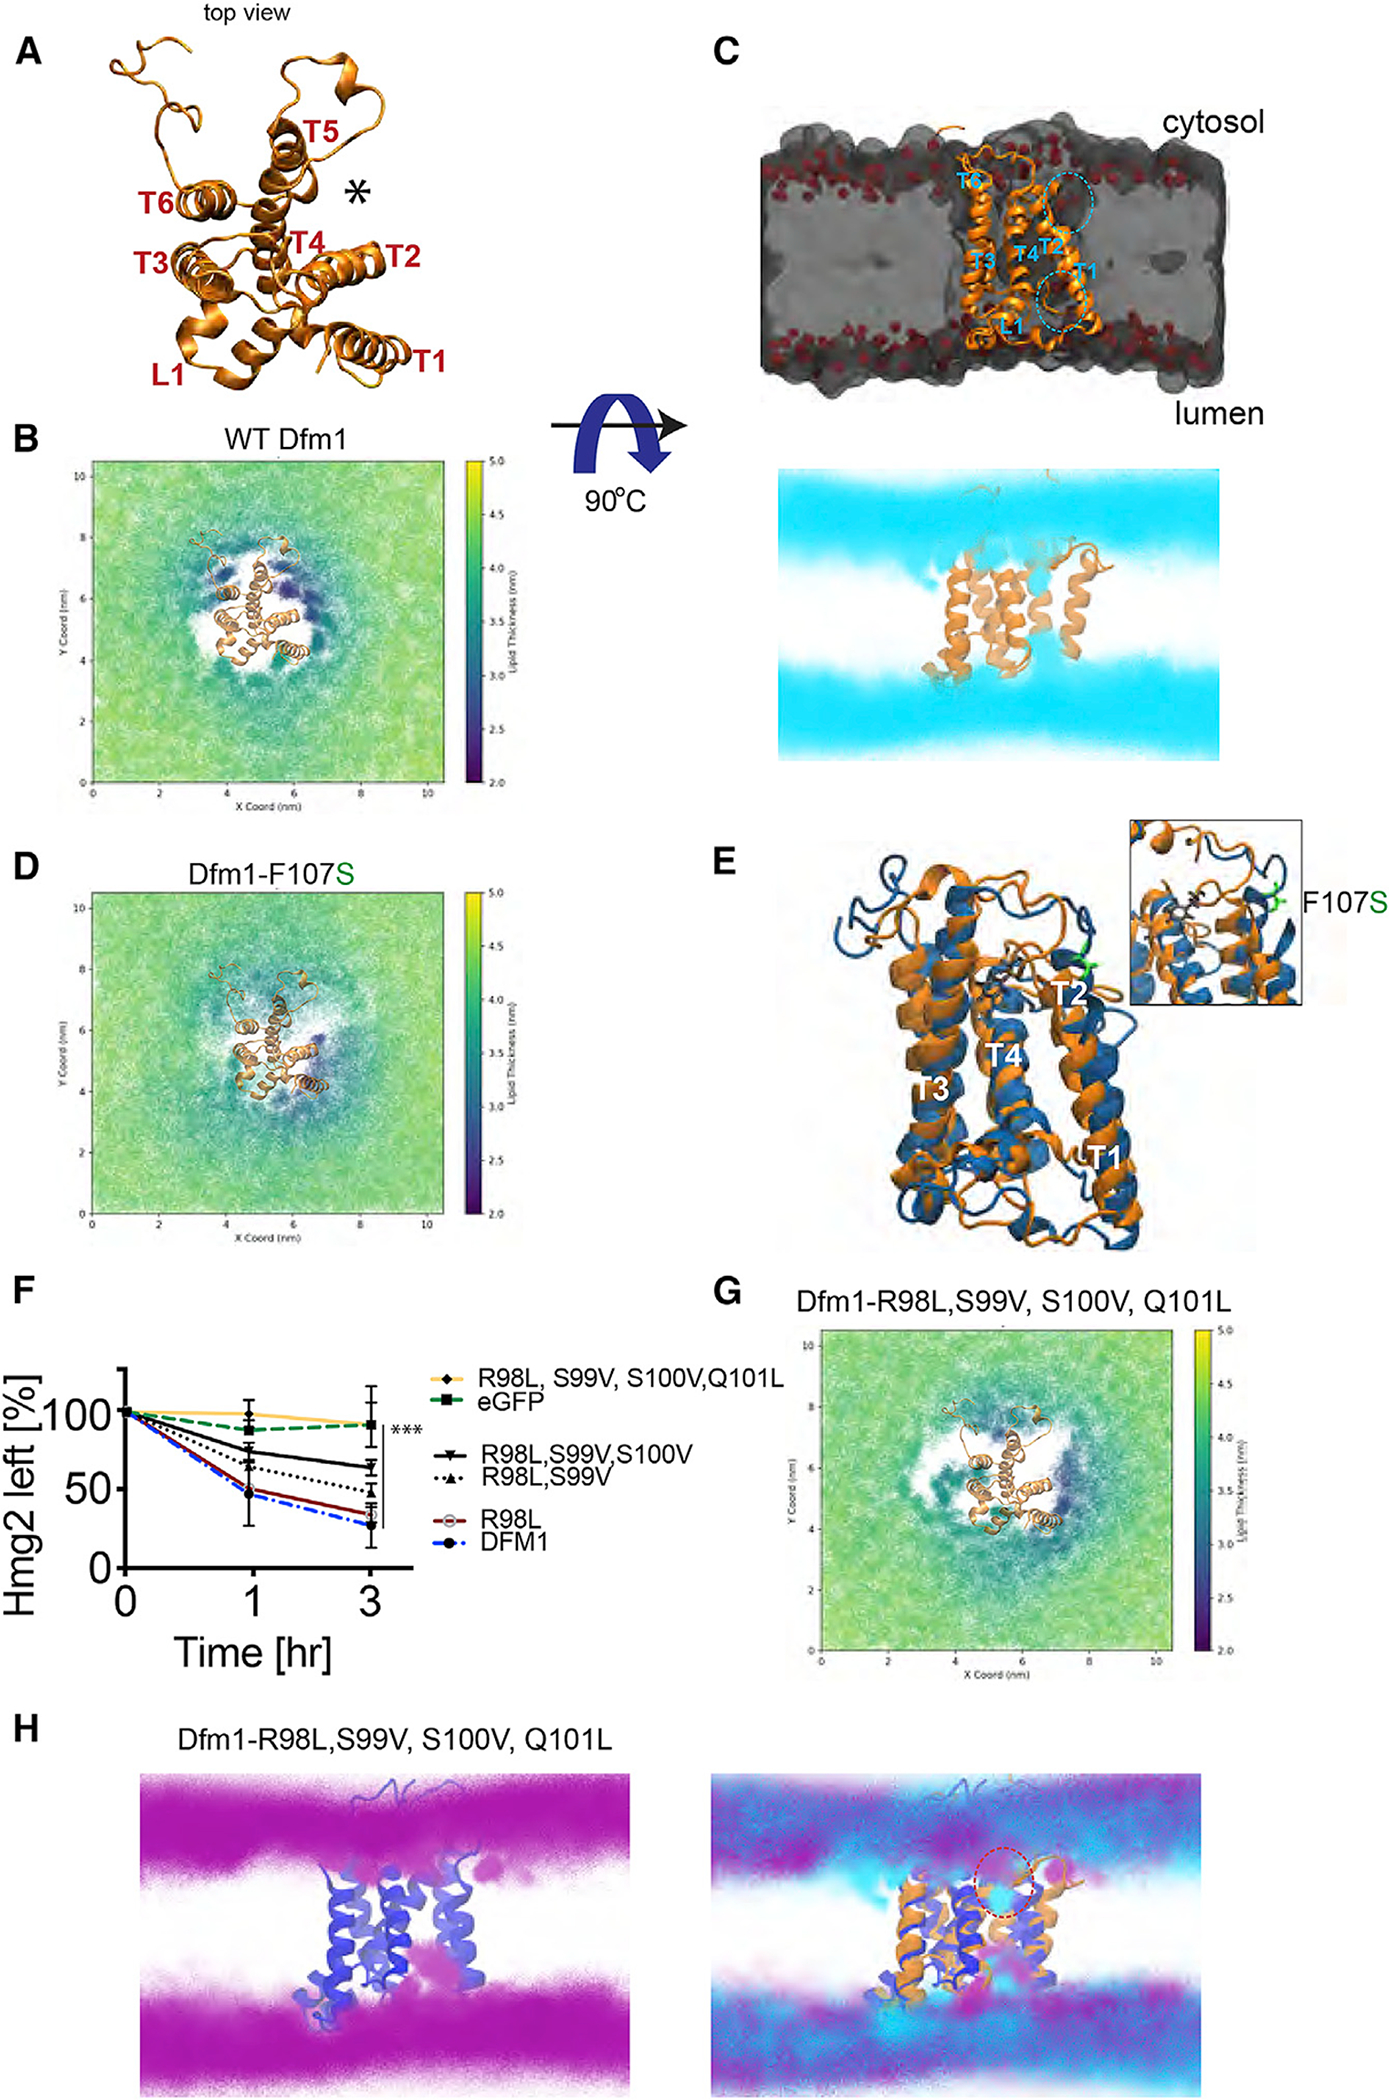
Figure 6. Membrane thinning by Dfm1.

(A) Top view of S. cerevisiae derlin, Dfm1, homology model shown in gold ribbon.
(B) Membrane thickness of the cytosolic leaflet is shown as x and y 2D maps of the positions of the lipid head groups every 1 ns of simulation and colored by the membrane thickness. Total thickness, i.e., the distance calculated between the upper and lower surfaces used for the analyses, is shown color coded in the 2.0 to 5.0 nm range.
(C) Midpoint cross section of the membrane where Dfm1 is embedded. Dfm1 is shown in gold ribbon, the lipids are shown in a gray volumetric representation, and the phospholipid headgroup is shown in red. Lipid headgroup densities from the simulation are shown in cyan from a lateral view of TM1, TM2, and TM5.
(D) Same as (B), except membrane thickness was measured for Dfm1-F107S.
(E) Protein structure clusters with the highest prevalence (~50% of simulation time) of the WT protein (gold) and F107S protein (blue), highlighting the residue positional difference in F107 (black) and F107S (green).
(F) CHX-chase assay was performed on dfm1Δ strains expressing the indicated Dfm1 mutants and Hmg2-GFP levels were measured by flow cytometry. Data are represented as mean ± SEM from n = 3 biological replicates, ***p < 0.001, repeated-measures ANOVA.
(G) Same as (B), except membrane thickness was measured for Dfm1-R98L, S99V, S100V, and Q101L.
(H) Same as (C), showing the lipid head group densities for the Dfm1 quad mutant (purple) with the protein structure (blue) and overlayed with the WT Dfm1 lipids (cyan) and protein (orange).
