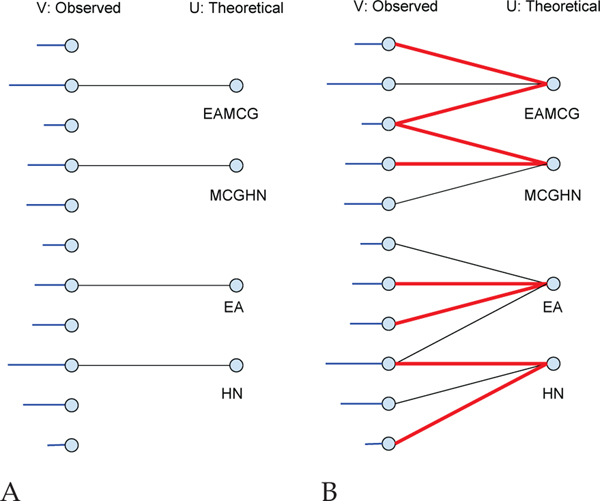
Fig. 1. PSM bipartite graphs.
(A) V is the set of all peaks in an observed spectrum. The horizontal lines attached on the left represent the peak intensities in the observed spectrum. U is the set of all fragment ions for a given theoretical spectrum derived from a given peptide. An edge (v, u) connects v ∈ V with u ∈ U if v might possibly be explained by u with an associated non-negative weight. (B) Red lines are selected edges for a particular match. Non-horizontal edges might correspond to neutral losses.

