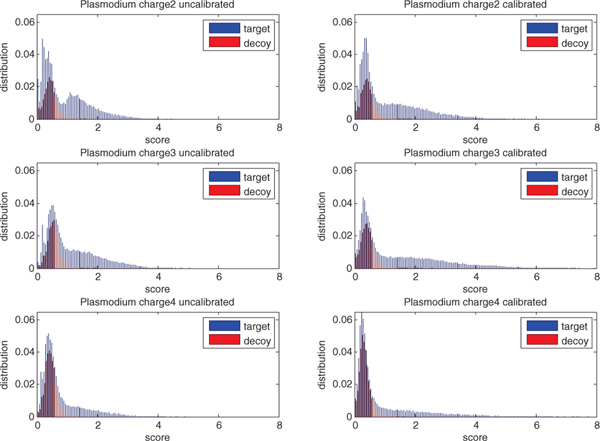
Fig. 6. Score calibration of SGM.
Each panel plots, for a single charge state, the SGM score distribution of top-scoring PSMs, separated into target and decoy distributions. Panels on the left are uncalibrated scores, and panels on the right are calibrated. In each plot, the x-axis is normalized so that the score threshold at q = 0.01 equals 1.

