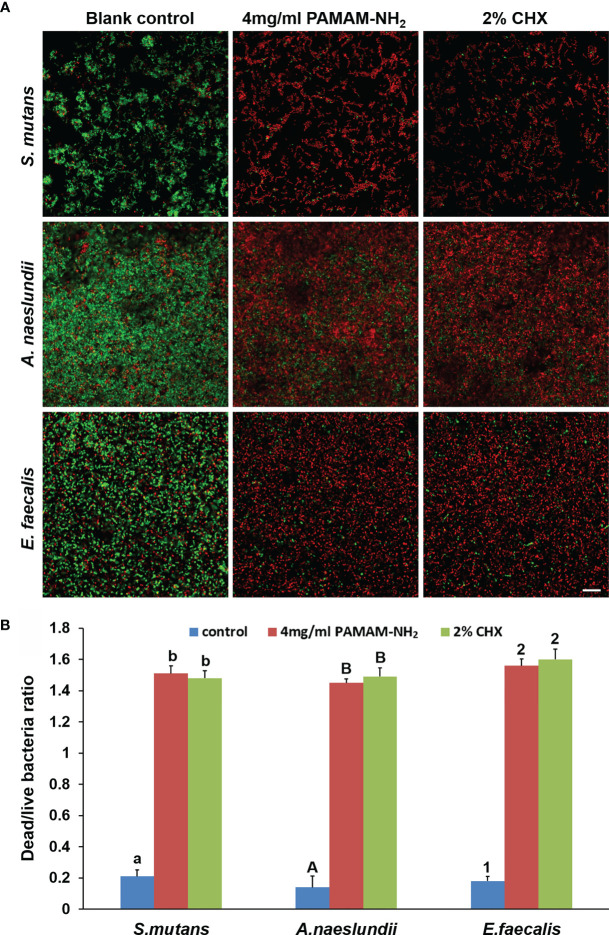
Figure 3.
(A) Representative CLSM images of Streptococcus mutans, Actinomyces naeslundii, or Enterococcus faecalis (live, green; dead, red) grown on dentin blocks after application of deionized water (control), and 4 mg/ml of PAMAM-NH2 or 2% CHX as cavity cleansers. Bars = 20 μm. (B) Bar chart of the dead/live bacteria ratio of the three groups based on analysis of the live–dead staining profiles of the dentin blocks. Values are means and SDs. Data obtained in the three groups (N = 6/group) were analyzed. For each bacterium strain, columns labeled with different letters or numbers are significantly different (p < 0.05). CLSM, confocal laser scanning microscopy

