Figure 3.

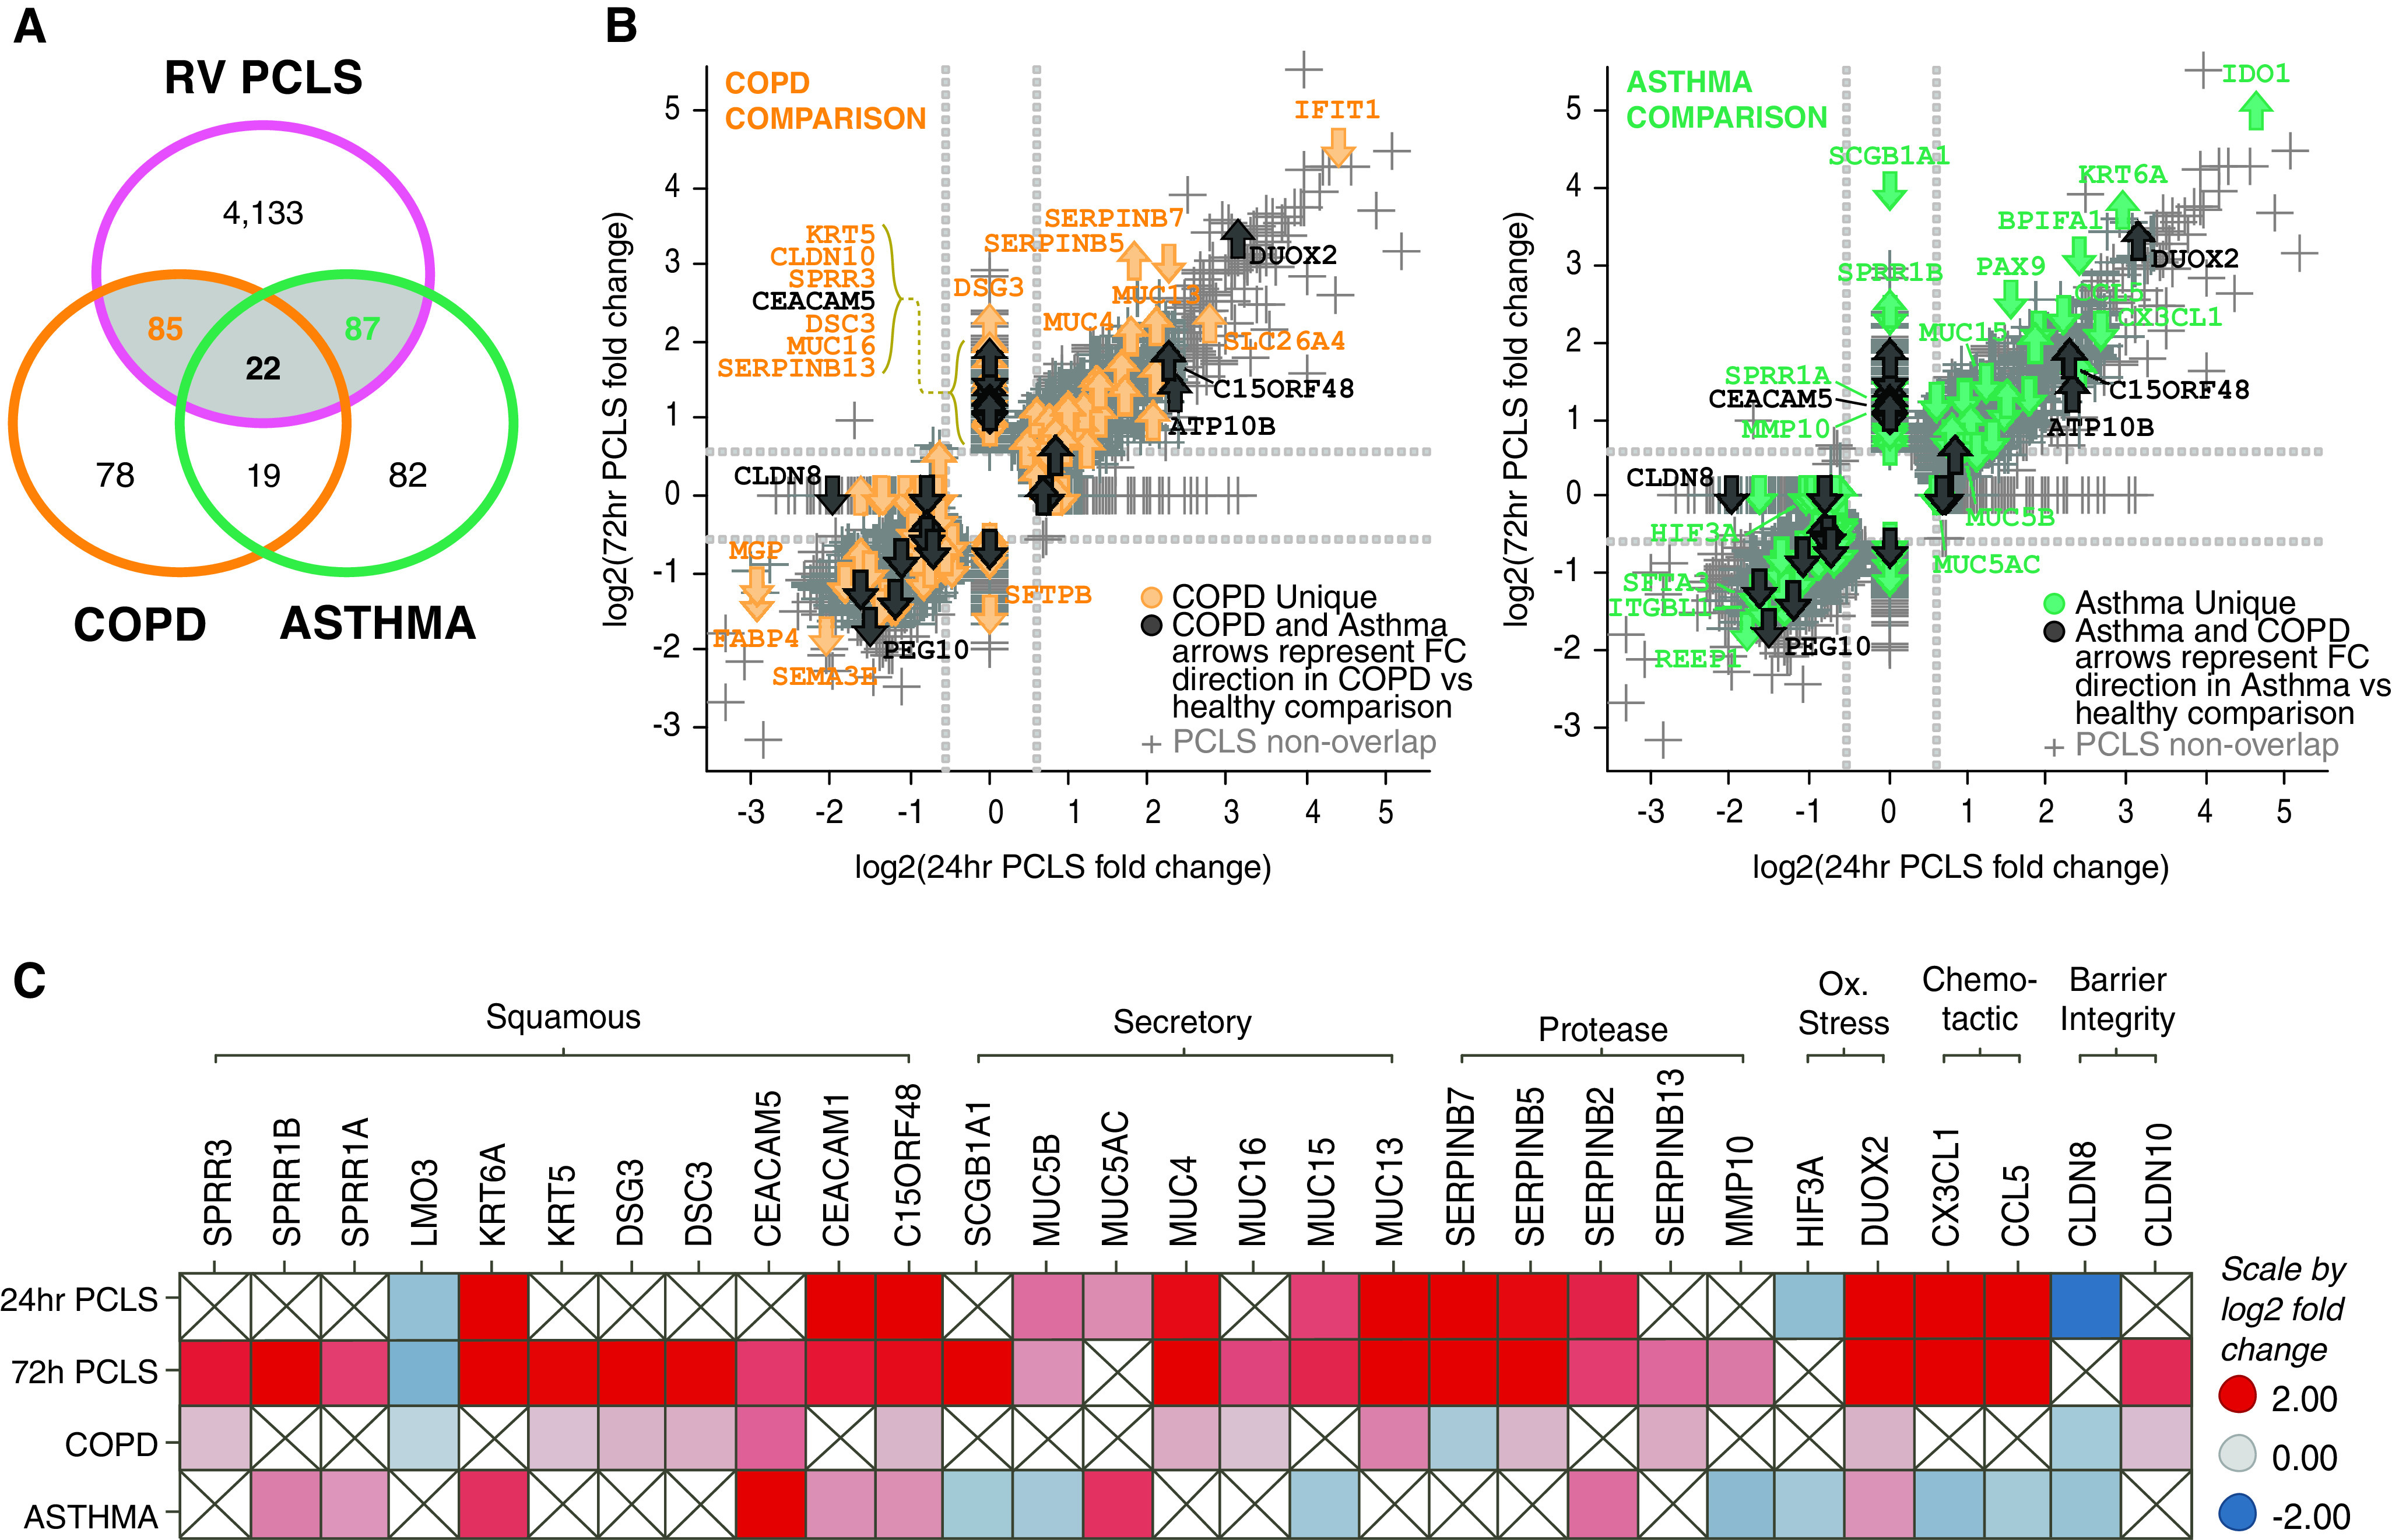
RV-induced gene signatures in precision-cut lung slices (PCLS) overlap with chronic obstructive pulmonary disease (COPD) and asthma gene signatures. Gene signatures from RV-infected PCLS (significant at either 24 h or 72 h time point with >1.5-fold change; P < 0.05) were compared with gene expression data sets from patients with COPD (GSE37147) (20) and asthma (GSE76226) (19). (A) Venn diagram illustrating that ∼50% of the disease-relevant genes (107 of 204 in COPD and 109 of 210 in asthma) were induced by RV in PCLS. (B) All genes significantly regulated in PCLS were plotted versus COPD-regulated (left) or asthma-regulated (right) genes in scatter plots. Gray markers represent every probe of the PCLS data set. Colored arrows highlight overlapping genes, thus indicating genes that were significantly regulated in PCLS by RV and were regulated in the respective disease data set (yellow = COPD [left]; green = asthma [right]; black = COPD and asthma). The direction of the arrow represents direction of regulation in the disease data set versus healthy control subjects (arrow up = upregulated; arrow down = downregulated). (C) Heatmap showing comparative analysis of selected overlapping genes grouped along disease-relevant biological processes and their regulation in PCLS (24 h and 72 h time points), COPD and asthma data set (red = upregulated; blue = down-regulated). N = 3 donors for 24 h after infection and N = 4 donors for 72 h after infection, with duplicate PCLS per condition.
