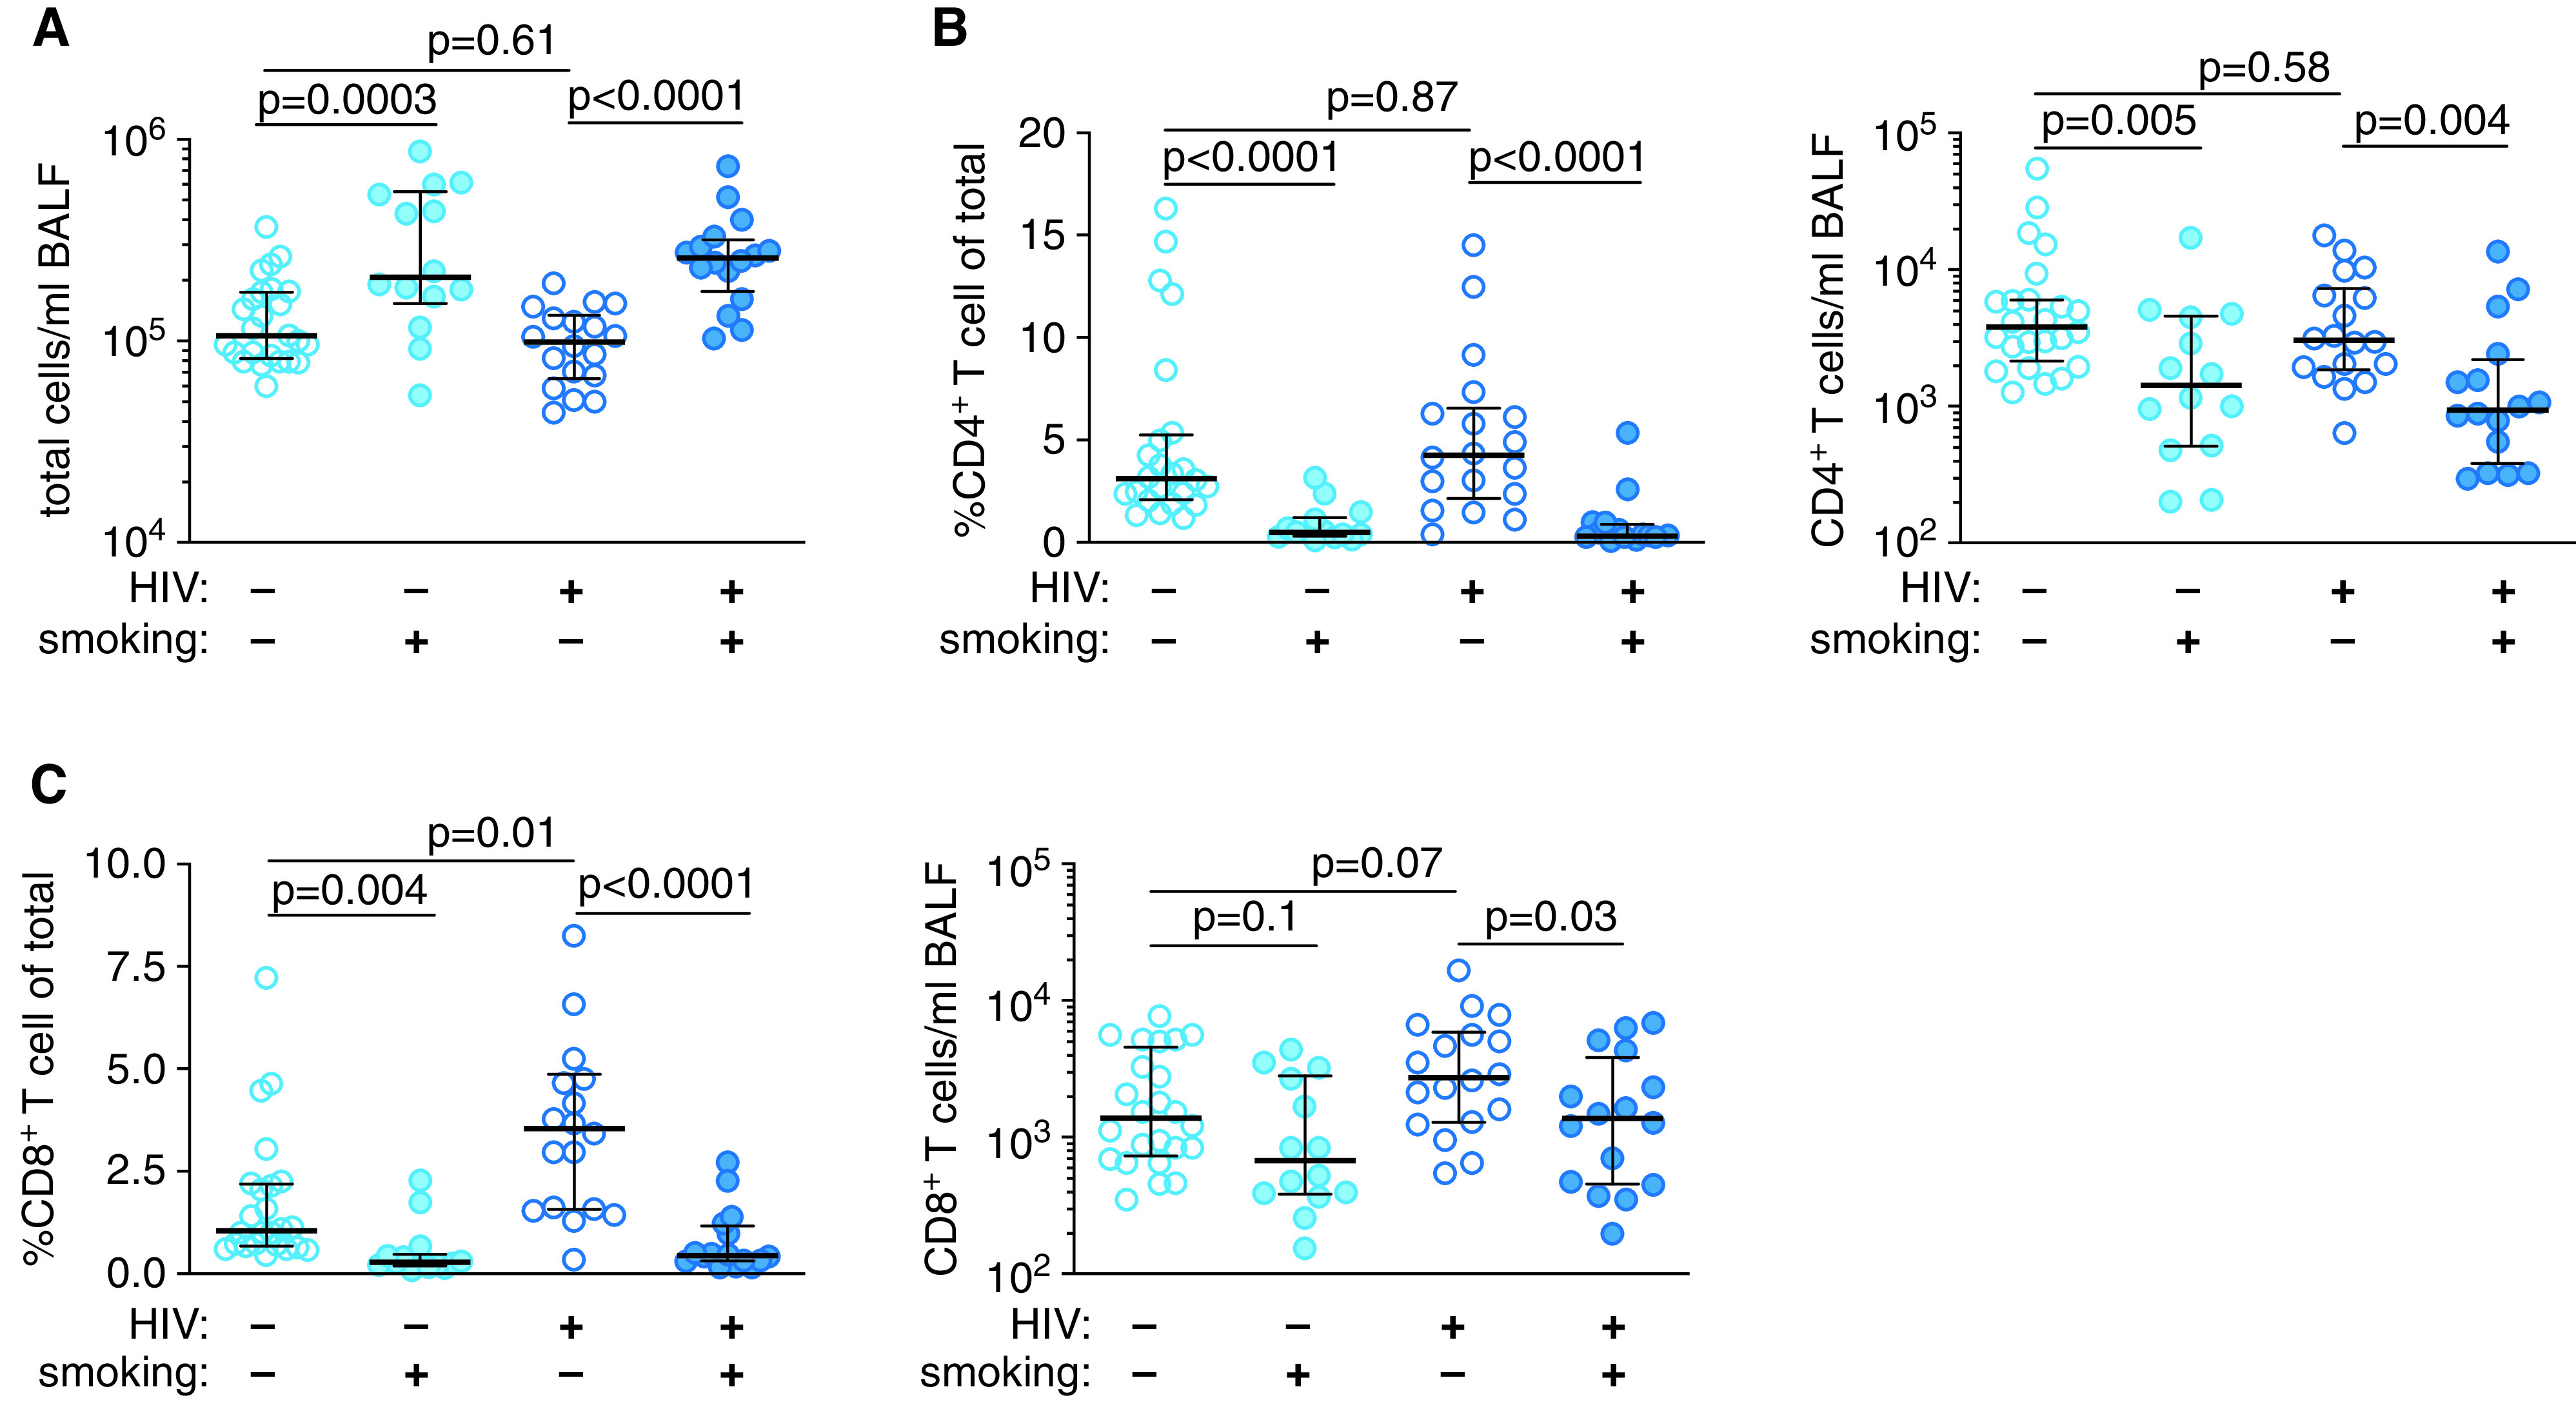
Figure 1.

Smokers have reduced BAL fluid (BALF) CD4+ and CD8+ T cells. (A) Total cells per milliliter of BALF. (B) CD4+ T-cell frequency and number per milliliter of BALF. (C) CD8+ T-cell frequency and number per milliliter of BALF. P values were determined by using nonparametric one-way ANOVA with the Dunn’s test for multiple comparisons. Scatter plots are labeled with the median and interquartile range. HIV = human immunodeficiency virus.
