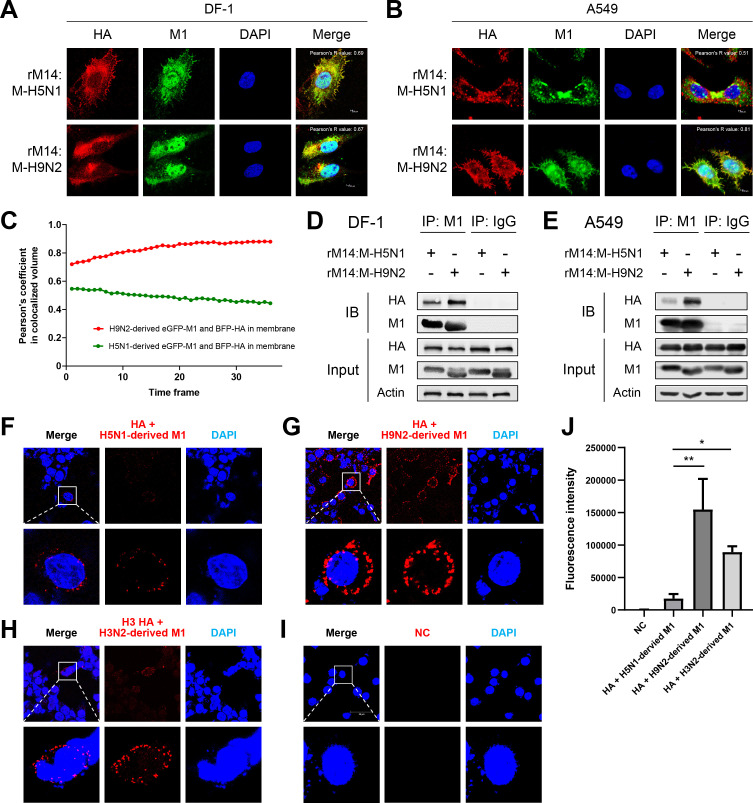
Fig 3. H9N2 virus-derived M1 protein strongly bound HA protein in mammalian cells.
(A-B) DF-1 or A549 cells were infected with rM14:M-H5N1 or rM14:M-H9N2 viruses at an MOI of 1. Confocal microscopy was performed to detect H5N6 HA and M1 protein localization in cells (green and red fluorescence resulting in a yellow color denote colocalization). (C) The dynamic colocalization 24 h post-transfection as observed via live imaging of H9N2 virus-derived eGFP-M1/BFP-HA or H5N1-derived eGFP-M1/BFP-HA transfected A549 cells. Pearson’s coefficients were analyzed in co-localized volume between eGFP-M1 and BFP-HA located at the membrane in 36-time frames (1-time frame duration = 42.62 s). (D–E) Physical interaction of viral M1 and HA proteins in cells. (D) DF-1 or (E) A549 cells separately infected with rM14:M-H5N1 and rM14:M-H9N2 viruses at an MOI of 1. At 24 hpi, cell lysates were immunoprecipitated using anti-M1 antibody or anti-IgG antibody, followed by Western blotting for influenza M1 and HA proteins. In A549 cells, an increased binding ability was observed between H9N2-derived M1 and HA proteins than between H5N1-derived M1 and HA proteins. IB, immunoblot. (F–H) interaction between influenza HA and M1 protein was determined by proximity ligation assay. 293T cells were co-transfected with (F) H5 HA and H5N1-derived M1, (G) H5 HA and H9N2-derived M1, (H) H3 HA and H3N2-derived M1, or (I) empty vector as negative control (NC). 24 h post transfection, PLA was performed using antibodies specific to influenza M1 and HA proteins. Fluorescence of cells was analyzed by a fluorescence confocal microscope (red fluorescent signal). Nuclei were stained with DAPI (blue). (J) Multiple images (F–I) were processed by BlobFinder software to measure the PLA fluorescence intensity (~30 cells total for each condition). Graphs show the means ± SD of three independent experiments (*, P < 0.05; **, P < 0.01).

