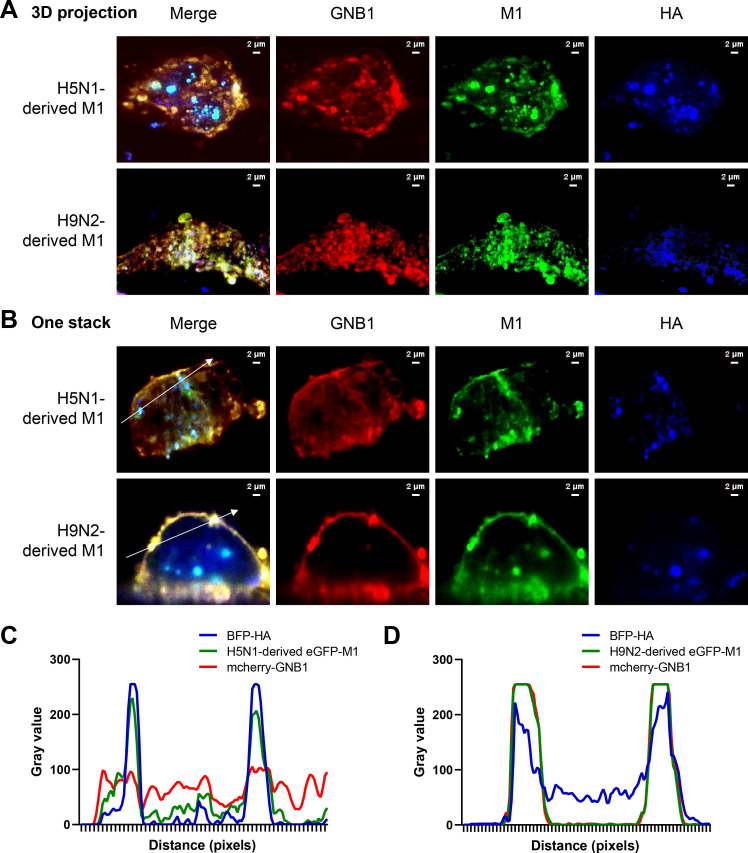
Fig 6. mCherry-GNB1 specifically co-localized with H9N2 virus-derived eGFP-M1 protein.
(A–B) Visualization of the single-channel images showing the localization of BFP-HA (blue), eGFP-M1 (green), and mCherry-GNB1 (red) in A549 cells, measured after co-transfecting H9N2-derived eGFP-M1/BFP-HA/mCherry-GNB1 or H5N1-derived eGFP-M1/BFP-HA/mCherry-GNB1 in (A) 3D projection or (B) one stack (Z-start: 0.0 μm, Z-end: 50.0 μm, Z-step: 0.5000 μm) using line profiles in image-analysis software platform Fiji. (C–D) The fluorescence intensity profile was plotted along the white arrow crossing the cell membrane in Fig 6B using ImageJ/Fiji software. The signal intensities (absolute gray values from 16-bit raw images) are plotted, where Y-axis shows the signal intensity, and X-axis shows the length of the line. The line profiles from three different channels are merged into one graph. Two different expression patterns are shown, highlighting the differences in the mCherry-GNB1 (red) and the similarities in the BFP-HA (blue) and eGFP-M1 (green) signal. Scale bars: 2 μm.

