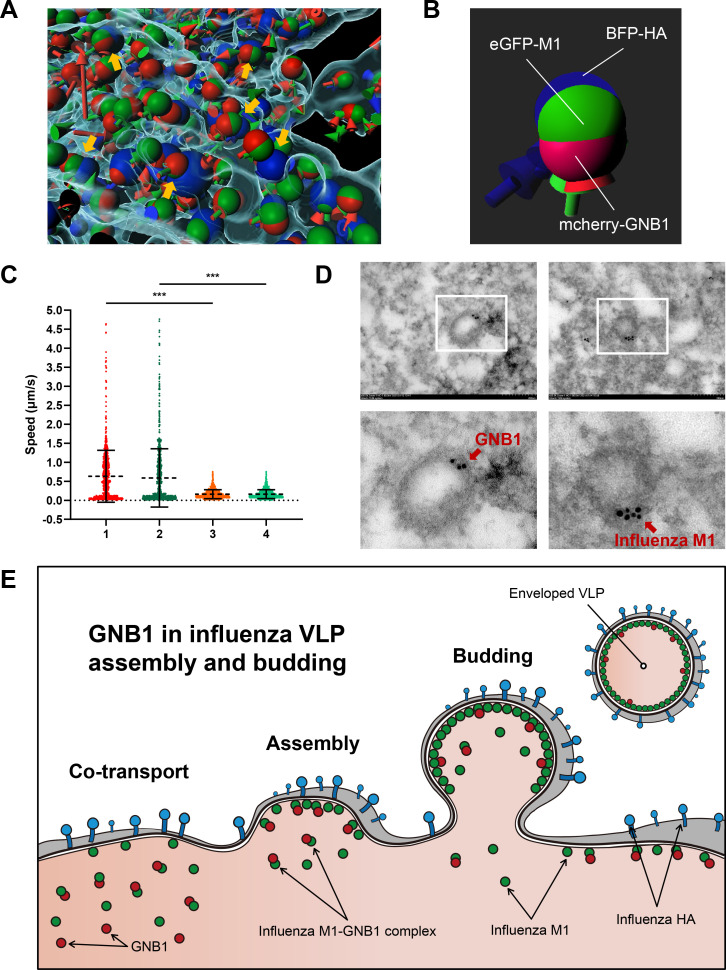
Fig 7. GNB1 protein co-transported with M1 protein in A549 cells.
(A) A549 cells were transfected with eGFP-M1, BFP-HA, and mCherry-GNB1 expression plasmids. Cross-section through the volume depicts the signal from the three channels. Yellow arrowheads indicate the co-localized puncta corresponding to co-transport of eGFP-M1 and mCherry-GNB1 to BFP-HA (S1 Movie). The blue, green, and red arrows or balls represent the tracks or punctas of BFP-HA, eGFP-M1, and mCherry-GNB1, respectively. (B) Enlarged view of the combination of H9N2-derived eGFP-M1, BFP-HA, and mCherry-GNB1. (C) Live-cell imaging illustrating the dynamic movement of the fluorescent fusion protein puncta within a cell with a similar number of spots and tracks between H9N2-derived eGFP-M1/BFP-HA/mCherry-GNB1 and H5N1-derived eGFP-M1/BFP-HA/mCherry-GNB1 transfected cells, which quantifies the track speed (ratio of track length to track duration [μm/s]) to characterize the intracellular movement. Each datapoint represents a punctum from the corresponding channel for the motion parameters (track speed) of eGFP-M1 singletons and mCherry-GNB1 singletons. “1” and “2” denote the speed of mCherry-GNB1 and H9N2-derived eGFP-M1 in H9N2-derived eGFP-M1/BFP-HA/mCherry-GNB1, respectively. “3” and “4” denote the speed of mCherry-GNB1 and H5N1-derived eGFP-M1 in H5N1-derived eGFP-M1/BFP-HA/mCherry-GNB1, respectively. (D) IEM analysis of influenza virus in the supernatant from infected cells. A549 cells were infected with rM14:M-H9N2 virus at an MOI of 1. At 24 hpi, supernatants from infected cells were collected for IEM. Anti-GNB1 or anti-influenza M1 antibody were used as the primary antibody. The gold is 10 nm in diameter. (E) Proposed model of the roles of GNB1 in viral assembly and budding of influenza VLPs.

