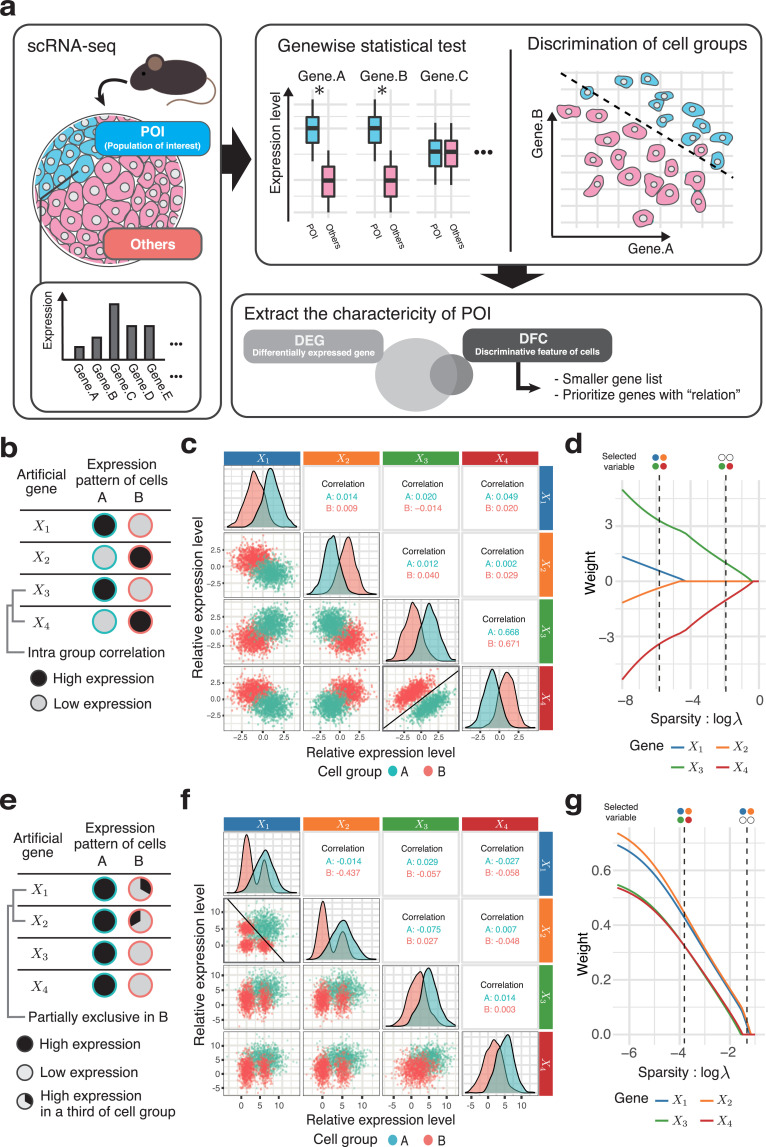
Fig 1. The dependent pairs of gene expression selected as the DFC.
(a) Different concepts for gene selection of DFC and DEG. The common goal is to extract a set of genes that characterizes the population of interest (left). A DEG-based approach involves a list of genes with statistically significant differences between the studied groups. In contrast, the DFC-based approach involves a subset of genes that distinguish between two populations (top-right). DFC is expected to feature a small set of genes selected by taking into account the relationships among genes (bottom-right). (b–d) Artificially generated data set in which DFC has priority over DEG; case 1: correlation. (b) Schematic of the synthesized data design. Only the pair X3 and X4 has intra-group correlation; the other pairs are independent. All variables have the same variance, and the differences in means are the same for all pairs (see Materials and Methods for details). (c) Pairs that are easier to classify are given priority to become DFC. The lower triangle shows the plot of each pair of variables; the diagonal elements show the distribution of each variable and the upper triangle shows the correlation coefficient within the cluster of each two variables. The decision boundary in the plain of the selected variable pair X3 and X4 is shown as a solid line. (d) The process of selecting discriminative variables; solution path. This indicates transition of the weights (partial regression coefficients) of each variable when regularization parameter λ (sparsity) is varied. (e–g) Synthesized data set in which DFC has priority over DEG; case 2: exclusive. (e) Schematic of the synthesized data design. In one-third of the group A cells, the expression of X1 and that of X2 are mutually exclusive. The variances and the means of variables are designed as in case 1. In other words, this simulates a logical product relationship such that cells that express X1 and X2 simultaneously are equivalent to the population of group A. (f) An example of logical relationships of case 2, shown in a scatter plot as in (c). (g) The solution path in case 2 as shown in (d).

