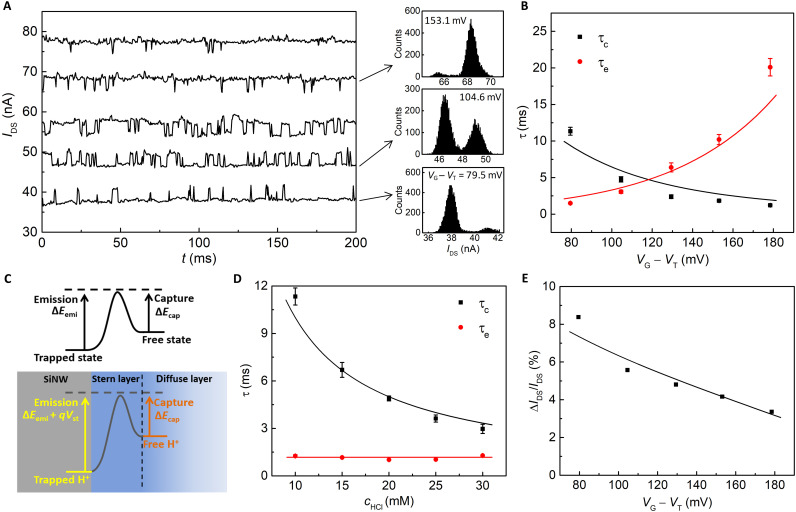
Fig. 3. Analysis of single H+-DB interactions of Dev. A.
(A) IDS traces recorded at various VG − VT in 10 mM HCl with 3-kHz sampling frequency. The histograms of IDS present the change of occupancy status of the single DB by VG. (B) Extracted τc and τe as a function of VG − VT. (C) Schematics of energy barriers of a general analyte-receptor reaction process (top) and the H+ capture and emission process on the SiNWFET surface (bottom). (D) τc and τe as a function of HCl concentration at IDS = 40 nA. (E) Relative signal amplitude as a function of VG − VT. The solid curves in (B), (D), and (E) are the fitting results.

