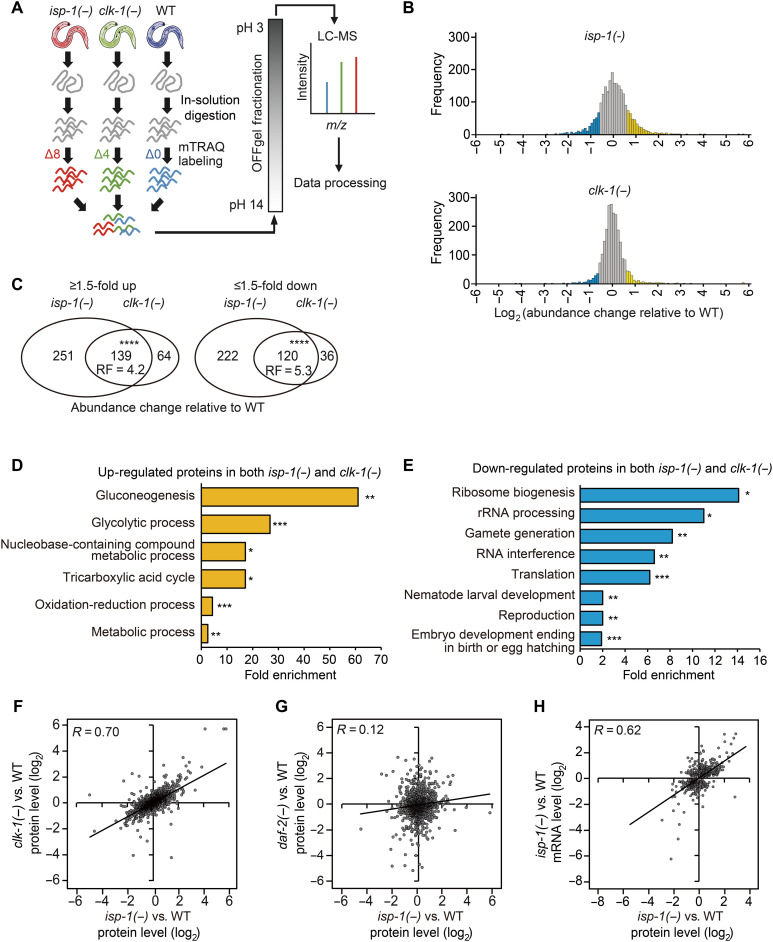
Fig. 1. Quantitative proteomic analysis identifies proteins differentially expressed in mitochondrial respiratory mutants.
(A) Schematic flow of mTRAQ proteomic analysis using isp-1(qm150) [isp-1(−)], clk-1(qm30) [clk-1(−)], and WT animal samples. (B) Histogram showing the frequency of proteins whose levels were changed in isp-1(−) and clk-1(−) mutants compared with those in WT animals (blue: ≥1.5-fold down-regulated proteins; yellow: ≥1.5-fold up-regulated proteins). (C) Up-regulated and down-regulated proteins (≥1.5-fold) significantly overlap between isp-1(−) and clk-1(−). (****P < 0.00001, chi-square test). RF, representation factor. (D and E) GO analysis [the database for annotation, visualization, and integrated discovery (DAVID)] (72) of proteins whose levels were increased (D) or decreased (E) ≥1.5-fold in both clk-1(−) and isp-1(−) mutants compared with those in WT animals (*P < 0.05, **P < 0.01, and ***P < 0.001, Benjamini P value). (F and G) Correlation between abundance changes in the protein levels in isp-1(−) and clk-1(−) (F) or isp-1(−) and daf-2(e1370) [daf-2(−)] mutants (G) relative to the levels in WT animals (R, Pearson correlation coefficient). (H) Correlation between abundance changes in the protein and mRNA levels in isp-1(−) mutants relative to those in WT animals (R). See table S1 for analysis of proteomics data.

