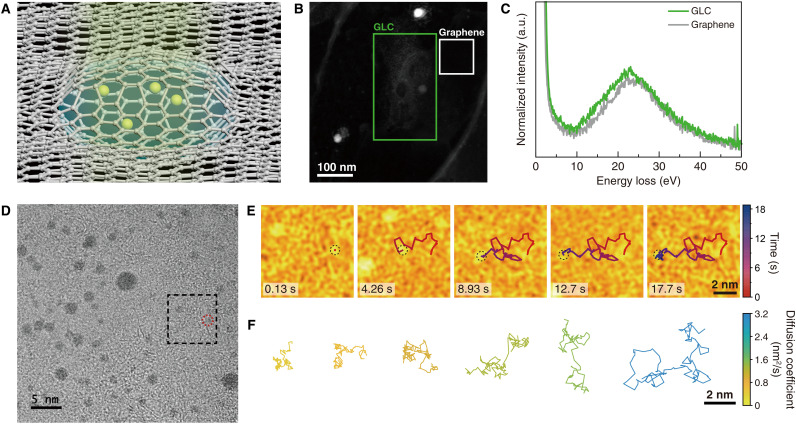
Fig. 1. Thermal motion of ligand-passivated gold nanoparticles in GLC.
(A) Schematic illustration of nanoparticles moving in a GLC. (B) Annular dark-field scanning TEM image of a GLC, where electron energy loss (EEL) spectroscopy was performed. (C) Low-loss EEL spectra of the GLC (green line) and the graphene-only region (gray line). The regions where EEL spectroscopy was performed are marked in (B). The peak at ~23 eV in the EEL spectrum of the GLC originates from the plasmon of water (23). The peak at ~25 eV in the EEL spectrum of the graphene-only region originates from the plasmon of multilayer graphene (22). a.u., arbitrary units. (D) A snapshot of the in situ TEM movie of the gold nanoparticles in a GLC. (E) False-color TEM images of the boxed region in (D), showing the random movement of the nanoparticle. (F) Representative trajectories of gold nanoparticles tracked longer than 8 s, color-coded by their diffusion coefficient (see also Fig. 2A).

