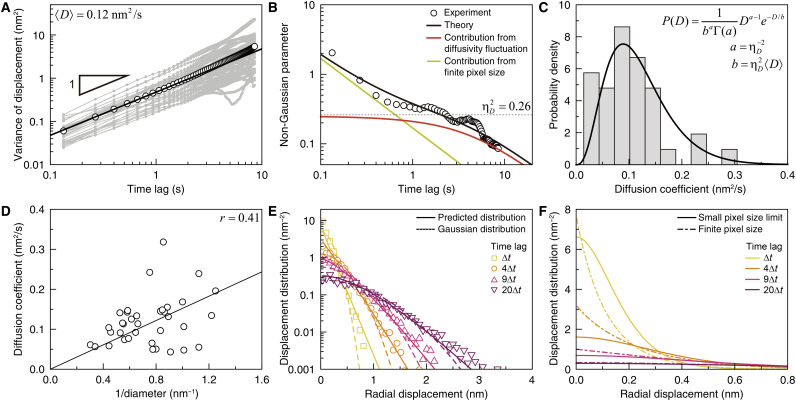
Fig. 2. Transport dynamics of gold nanoparticles in GLC.
(A) Single-particle variance (gray symbols) and time ensemble–averaged variance (black symbols) of nanoparticle displacements. (Black line) Best fit by 4〈D〉t. (B) Non-Gaussian parameter (NGP) of the nanoparticle displacement. (Symbols) Experimental data. (Black line) Optimized theoretical estimation of the experimental data according to Eq. 1A. (Red and green lines) Theoretical estimations of the contribution from diffusion coefficient fluctuation and the contribution from the finite pixel size of the TEM detector. (Dotted line) Relative variance, , of nanoparticle diffusion coefficients. The relaxation time of diffusion coefficient fluctuation is found to be 3.58 s. (C) Distribution of the diffusion coefficients of nanoparticles, measured from the single-particle variances at times shorter than 1 s. The single-particle variances are presented in (A). (D) Inverse size dependence of nanoparticle diffusion coefficient. (Line) Stokes-Einstein relation. (E) Distributions of nanoparticle displacements at various times. (Symbols) Experimental data. (Dashed lines) Gaussian distributions calculated with the time ensemble–averaged variance of nanoparticle displacements in (A). (Solid lines) Theoretical prediction made by Eq. 1B. (F) Theoretical prediction of the nanoparticle displacement distribution in the small pixel limit (solid lines) compared to Eq. 1B (dot-dashed lines).

