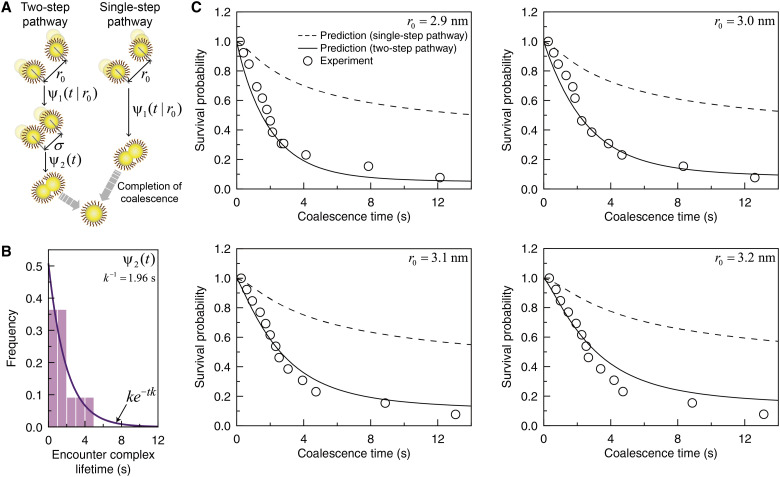
Fig. 5. Theoretical predictions and experimental results for coalescence dynamics for coalescence kinetics.
(A) Schematic illustrations for the two-step coalescence pathway involving an encounter complex formation (left panel) and the single-step coalescence pathway without assuming the formation of the encounter complex (right panel). At the first step of the two-step pathway, the distribution of time taken for a pair of nanoparticles initially distant by r0 to form the complex at the contact separation, σ, is denoted by ψ1(t|r0). At the second step, the lifetime distribution of the encounter complex is denoted by ψ2(t), which is given by an exponential distribution, ψ2(t) = ke−tk. For the single-step pathway, nanoparticles coalesce at the sum of the nanoparticle radii (section S4). (B) Lifetime distribution of the encounter complex. (Histogram) Experimental data. (Solid line) Best fit of exponential distribution, ke−tk, to the experimental lifetime distribution, with the value of k given by 0.51 s−1. (C) Survival probability of nanoparticles at various values of initial separations. (Symbols) Experimental data. (Solid lines) Theoretical predictions based on the two-step coalescence pathway shown in the left panel of (A). (Dashed lines) Theoretical predictions based on the single-step pathway shown in the right panel of (B).

