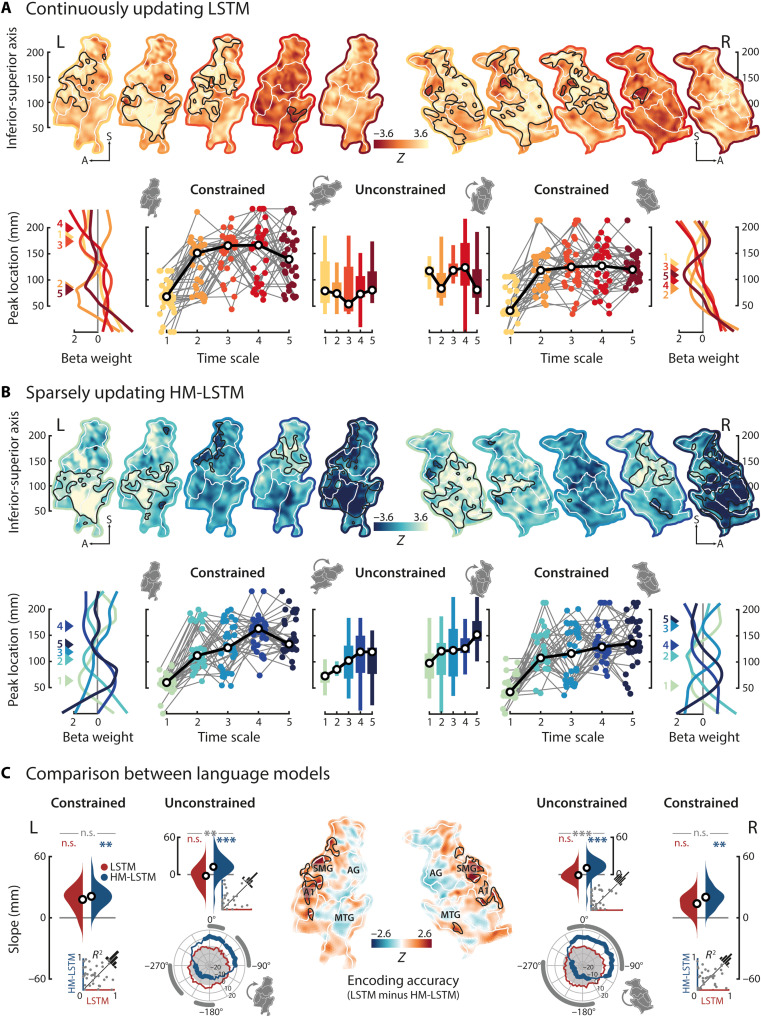
Fig. 4. Encoding surprisal at multiple time scales.
(A) Top row: Temporoparietal weight maps of LSTM-derived surprisal at each time scale were tested against zero; positive z values indicate increased BOLD activity in response to more surprising words; black outlines, significant clusters; white outlines, parcels; colored outlines, short (light) to long (dark) time scales, separately for the left and right hemispheres. Bottom row: Time scale–specific peak coordinates were determined along the inferior-superior axis (colored triangles numbered according to time scale), shown for grand-average weight profiles. Testing for a processing hierarchy along the dorsal stream, time scales were constrained to peak superior to the first time scale; colored dots, single-subject peak coordinates; black circles, grand-median peak coordinates. In the unconstrained approach, time scales were allowed to peak at any location, and maps were rotated around the inferior-superior axis (shown for −45°) to test for the spatial specificity of the effect. (B) Same as above but for the HM-LSTM. (C) Linear functions were fit to peak coordinates across time scales, and resulting slope parameters were compared to empirical null distributions (LSTM, red; HM-LSTM, blue) and between language models (LSTM versus HM-LSTM, gray); black circles, grand-average slope parameters; insets, coefficients of determination for single-subject fits. In addition, we tested for slope effects around the full circle (rose plots); white areas indicate positive slope parameters; fat colored lines, significant slope clusters of single language models; fat gray lines, significant clusters of slope differences between language models. Maps of encoding accuracies were z-scored to null distributions drawn from scrambled features of predictiveness and compared between language models. SMG, supramarginal gyrus; AG, angular gyrus; A1, primary auditory cortex; MTG, middle temporal gyrus. Maps were smoothed with an 8-mm FWHM Gaussian kernel for illustration only. **P < 0.01 and ***P < 0.001.

