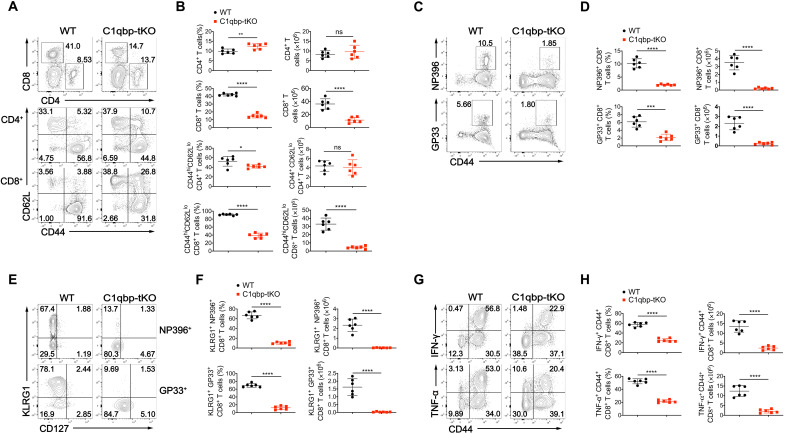
Fig. 2. C1qbp ablation in T cells leads to defective antiviral effector CD8+ T cell response.
(A) Flow cytometry of total splenocytes (top row) and splenic 2CD4+ (middle row) and splenic CD8+ (bottom row) T cells from WT and C1qbp-tKO mice at day 8 after infection with the LCMV Armstrong strain. (B) Frequency and total number of splenic CD4+ or CD8+ (among splenocytes), CD44hiCD62Llo effector CD4+ or CD8+ T cells (among splenic CD4+ or CD8+ T cells) from mice as in (A) (n = 6 per group). (C) Flow cytometry of splenic CD8+ T cells from mice as in (A). (D) Frequency (among splenic CD8+ T cells) and total number of NP396–404 (NP396)–specific (top row) and GP33–41 (GP33)–specific (bottom row) CD44+ CD8+ cells from mice as in (A) (n = 6 per group). (E) Flow cytometry of splenic NP396-specific (top row) and GP33-specific (bottom row) CD44+ CD8+ T cells from mice as in (A). (F) Frequency [among NP396-specific (top row) or GP33-specific (bottom row) CD44+ CD8+ T cells] and total number of NP396- or GP33-specific KLRG1+ effector CD8+ T cells in spleens of mice as in (A) (n = 6 per group). (G) Flow cytometry of splenic CD8+ T cells from mice as in (A). (H) Frequency (among splenic CD8+ T cells) and total number of IFN-γ+ (top row) or TNF-𝛂+ (bottom row) CD44+ CD8+ T cells in spleens of mice as in (A) (n = 6 per group). Each symbol represents an individual mouse; small horizontal lines indicate the means (±SD). *P < 0.05, **P < 0.01, ***P < 0.001, and ****P < 0.0001; ns, not significant (two-tailed unpaired Student’s t test). Data are representative of three independent experiments (error bars, SD).

