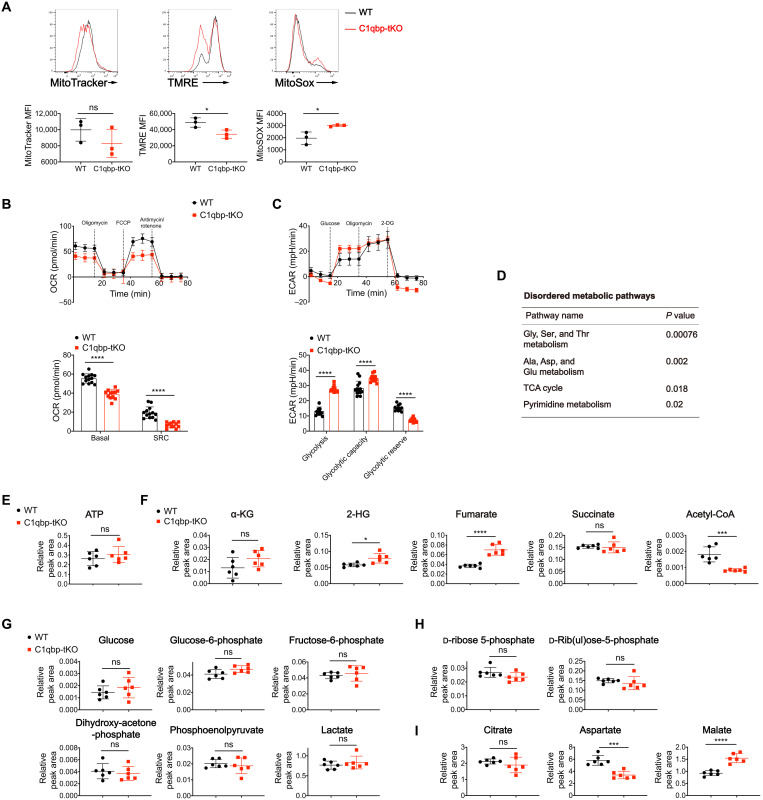
Fig. 4. C1qbp deficiency decreases acetyl-CoA and elevates fumarate and 2-HG in activated CD8+ T cells.
(A) Mitochondrial mass, mitochondrial membrane potential, and mitochondrial superoxide production were measured by MitoTracker Deep Red staining, tetramethylrhodamine ethyl ester perchlorate (TMRE) staining, and MitoSOX Red staining, respectively, in activated CD8+ T cells from WT or C1qbp-tKO mice at day 4.5 after infection with the LCMV Armstrong strain (n = 3 per group) . MFI, mean fluorescence intensity. (B and C) Seahorse extracellular flux analysis of OCR (B) and ECAR (C) of activated (CD44+) CD8+ T cells sorted from WT and C1qbp-tKO mice at day 8 after infection with the LCMV Armstrong strain (n = 12 to 14 wells per group). (D to I) Metabolomic analysis of WT and C1qbp-deficient P14 CD8+ T cells sorted from B6.SJL recipient mice respectively, at day 5 after infection with the LCMV Armstrong strain, was performed by mass spectrum. (D) Enrichment of the dysregulated metabolic pathways. (E) Relative abundance of ATP. (F) Relative abundance of α-KG, 2-HG, fumarate, succinate, and acetyl-CoA. (G to I) Relative abundance of metabolites in glycolytic (G), pentose phosphate pathway (H), and TCA cycle (I) (n = 6 per group). Each symbol represents an individual mouse; small horizontal lines indicate the means (±SD). *P < 0.05, ***P < 0.001, and ****P < 0.0001 (two-tailed unpaired Student’s t test). Data are representative of two independent experiments (error bars, SD).

