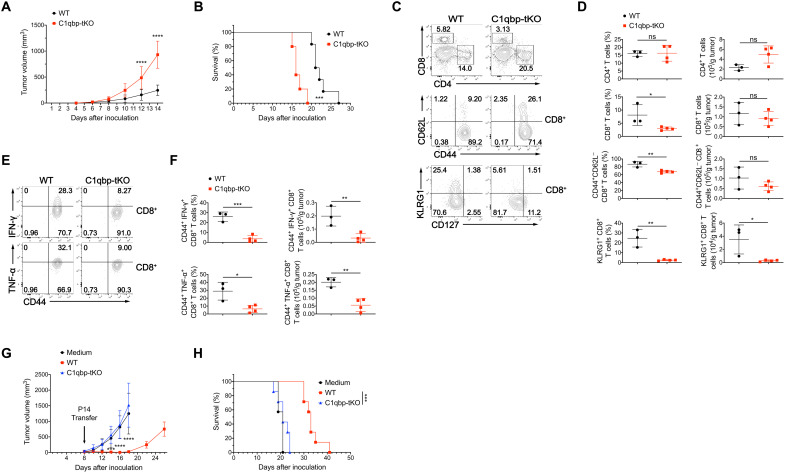
Fig. 8. T cell–specific deletion of C1qbp impairs antitumor immunity.
(A and B) Tumor growth (A) and survival curves (B) of WT and C1qbp-tKO mice injected subcutaneously with 2 × 10⁵ B16F10 melanoma cells (WT, n = 6; C1qbp-tKO, n = 5). (C) Flow cytometry of tumor-infiltrating lymphocytes (TILs) (top row), TIL CD8+ T cells (middle and bottom rows) from WT and C1qbp-tKO mice at day 12 after subcutaneous injection with 2 × 10⁵ B16F10 melanoma cells. (D) Frequency and total number of TIL CD4+ or CD8+ T cells (among TILs), CD44+CD62L− or KLRG1+ effector CD8+ T cells (among TIL CD8+ T cells) from mice as in (C) (WT, n = 3; C1qbp-tKO, n = 4). (E) Flow cytometry of TIL CD8+ T cells from mice as in (C). (F) Frequency (among TIL CD8+ T cells) and total number of IFN-γ+ (top row) or TNF-𝛂+ (bottom row) TIL effector CD8+ T cells from mice as in (C) (WT, n = 3; C1qbp-tKO, n = 4). (G and H) Tumor growth (G) and survival curves (H) of B16F10-GP33–bearing B6 mice received adoptive transfer of WT P14 cells, C1qbp-deficient P14 cells, or medium as control at day 8 after inoculation (n = 7 per group). Each symbol represents an individual mouse; small horizontal lines indicate the means (±SD). *P < 0.05, **P < 0.01, ***P < 0.001, and ****P < 0.0001 [two-way analysis of variance (ANOVA) (A and G), two-tailed unpaired Student’s t test (D and F), or log-rank (Mantel-Cox) test of survival curve (B and H)]. Data are representative of two (G and H) or three (A to F) independent experiments.

