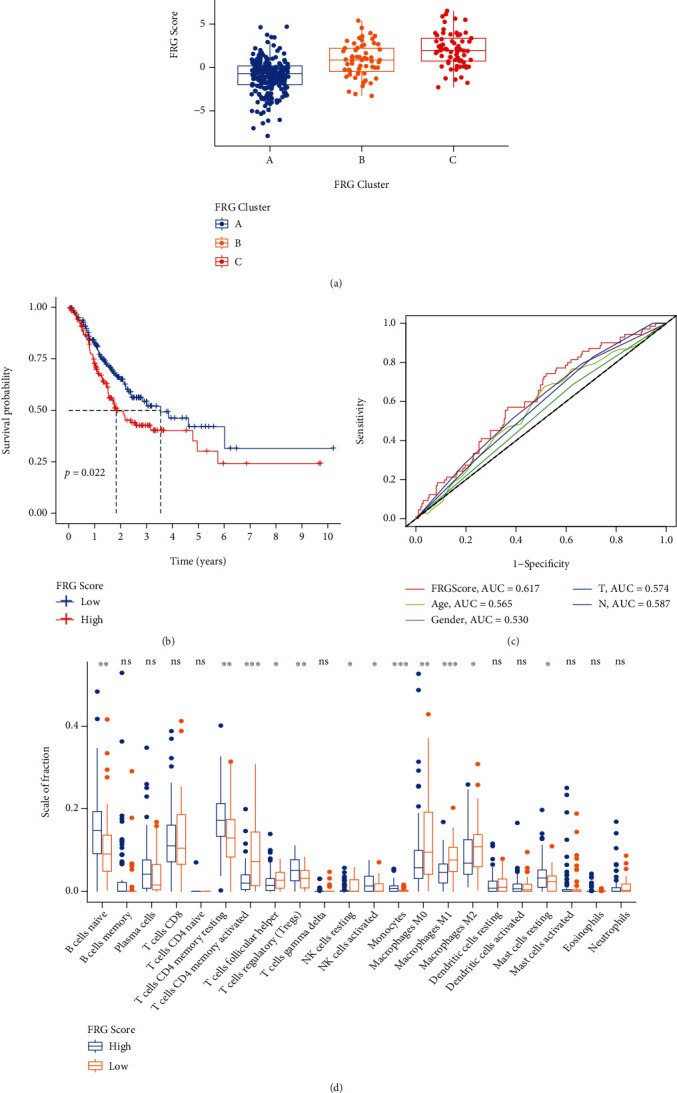
Figure 3.

Construction FRGScore. (a) Differences in FRGScore among three FRGClusters. (b) Kaplan-Meier curves indicated FRGScore were markedly related to overall survival of patients in the TCGA cohort. (c) ROC curves of FRGScore and other clinical factors. (d) Different immune cell subset infiltration of low and high FRGScore patient groups.
