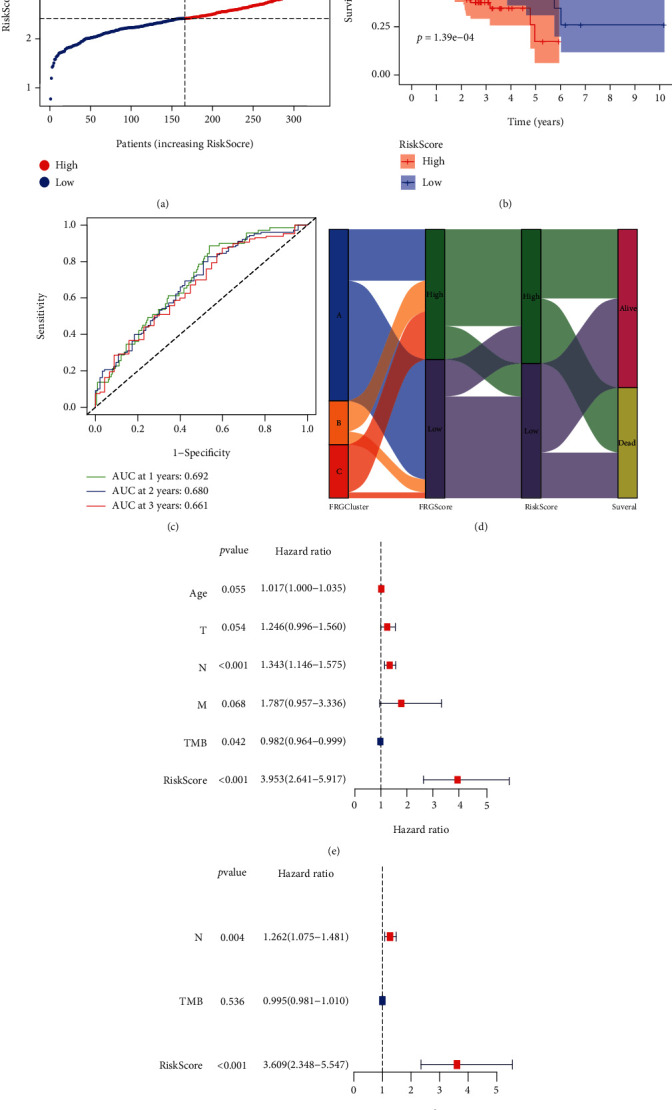
Figure 5.

Prognostic analysis of the 13-gene signature model in the TCGA cohort. (a) The distribution and median value of the RiskScores in the TCGA cohort. (b) Kaplan-Meier curves for the OS of patients in the high-risk group and low-risk group in the TCGA cohort. (c) AUC of time-dependent ROC curves verified the prognostic performance of the RiskScore in the TCGA cohort. (d) Alluvial diagram showing the changes of FRGClusters, FRGScore, RiskScore, and survival state. (e, f) Results of the univariate (e) and multivariate (f) Cox regression analyses regarding OS in the TCGA derivation cohort.
