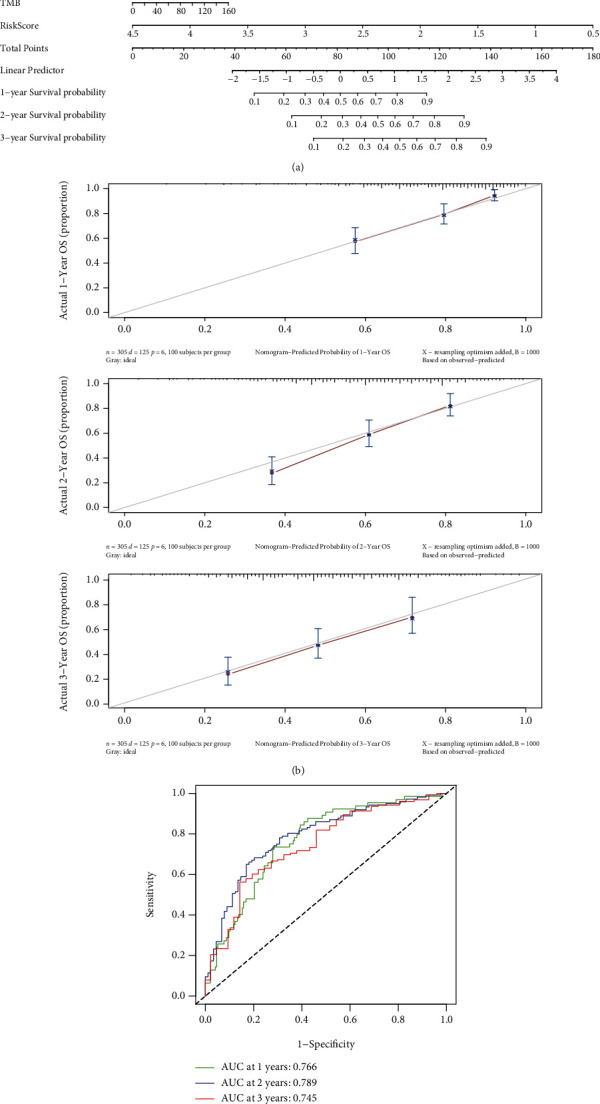
Figure 7.

Construction of a predictive nomogram. (a) The nomogram for predicting the OS of patients with GC at 1, 2, and 3 years. (b) Calibration curves of the nomogram for OS prediction at 1, 2, and 3 years. (c) ROC curves to evaluate the predictive ability of the nomogram.
